SUMO - Venn diagrams
From Wikipedia, the free encyclopedia:
"... Venn diagrams or
set diagrams are diagrams that show all hypothetically possible
logical relations between a finite collection of sets
(aggregation of things). ... They are used to teach elementary
set theory, as well as illustrate simple set relationships in
probability, logic, statistics, linguistics and computer science.
Venn diagrams normally comprise overlapping circles. The interior
of the circle symbolically represents the elements of the set,
while the exterior represents elements which are not members of
the set. For instance, in a two-set Venn diagram, one circle may
represent the group of all wooden objects, while another circle
may represent the set of all tables. The overlapping area or
intersection would then represent the set of all wooden tables.
Shapes other than circles can be employed, and this is necessary
for more than three sets. Venn diagrams do not generally contain
information on the relative or absolute sizes (cardinality) of
sets; i.e. they are schematic diagrams. ..."
In our case, we typically use Venn diagrams to show intersections between
genelists:
- Find differentially expressed genes in liver cancer vs. normal liver cells
=> Genelist 1
- Find differentially expressed genes in kidney cancer vs. normal kidney cells
=> Genelist 2
- Find differentially expressed genes in pancreas cancer vs. normal pancreas
cells => Genelist 3
- ...
Find the intersections
- Genelist1 AND Genelist2 AND Genelist3 => Those genes might be
involved in basic cancer mechanisms, as they are found in
all three tissues to be differntially regulated compared
to the corresponding "normal" cells
- Genelist1 AND NOT Genelist2 AND NOT GeneList3 => normal liver specific
genes, as they are only differntially expressed in liver
and are not found in the other two tissues.
- ...
Venn diagrams with SUMO:
For one to eight data sets you may generate explicite Venn-graphs:
Move the mouse accross the graph to see which groups participate to a certain intersection.
Double click the respective subset to view and copy the containing features.
Color and transparency may be customized.
For a two group venn, size and overlap may be set to reflect real count numbers.

Instead of the explicit Venn graphs you may use Heatmaps or CircleGraphs as alternative visualization.
Especially for dataset with moren then 8 groups.
You may widely customize the Heatmaps / CircleGraphs in the repective viewer.
Or perform further analyses, e.g. cluster the heatmap.
You may request (filter with "List-Venn") specific intersections.
E.g. Group1 AND Group3 but NOT Group5 AND NOT Group7 from a 8 Group data set.
For smaller group numbers (up to 4) you may compute enrichement p-values (Fisher exact test) for the respective intersections.
But for higher number of groups (> eight) - there is no explicit graphic visualisation available.
Here you may use List-Venn.
Instead of gene lists you may use any kind of feature lists lists, containing text patterens: genes, miRNAs, proteins, city names, phone numbers, play iists....'
Click the Venn button:
or select from Main menu | Analysis | Venn diagram
1-8 Group Venn analysis:
Go to to the Venn analysis tab-sheet.
Here you may compare up to 8 genelists simultaneously and generate explicit Venn diagrams.
Paste your liste of genes in one of the 8 group columns, always
left to right.
E.g. when comparing 2 lists, paste first list into column
Group-1, second list into column Group-2.
Click the target cell where you want to start pasting genes, then click the Paste button in
tool bar press CTRL+V.
SUMO expects a list of genes divided by New line, Carriage Return, TABs, SPACEs,
" , " ";" or "|".
Customize the field divider on the Preferences tab-sheet.
For example three pasted gene lists:
In the first line (Operator line) select AND to include the gene list into the analysis.
E.g. you pasted 8 feature lists, but want to generate a explict 3-Set Venn diagram from Group 1,3 and 5).
Just empyt the operator field for Grous 2,4,6,7,8 and Ececute agian.
In the Name line you may define custom group names.
Select Main menu | File | Save to store the table. You can reload the table
lateron wit Main menu | File | Open.
In stead of pasting gene lists you might drag tab delimited text files into the data grid and
drop them into the respective cell:
In the example there are three genelist files defined for Group1, two genelist files for Group2
and a single genelist file fro Group3.
SUMO loads the individual files and appends them within
one group, then compares the groups.
Gene list files MUST have the same structure and MUST be
stored as ASCII-text files, one gene per line.
In case the data files contain tab-delimited tables you can define which Key
column from the table shall be used (the same column for
all files witin a group).
In case you have header rows define the number of Header
lines - those are simply skipped from the data file and
not used in the analysis. Up to 50 individual files might be
defined per group.
Click the Execute button to compare the genelists.
SUMO extracts the gene names from the
data table (or from the gene list files defined in the table).
Replicated names are ignored, i.e. only unique gene names are
used for set analysis.
All keys from a single list are compared with all others.
Common keys are assigned to the corresponging intersection lists.
Matching keys MUST have the identical character sequence but case independant:
- "GAPDH" is the same as "gapdh"
- "HRPT" is NOT the same as "HPRT1"
- "HRPT1" is NOT the same as "HPRT-1"
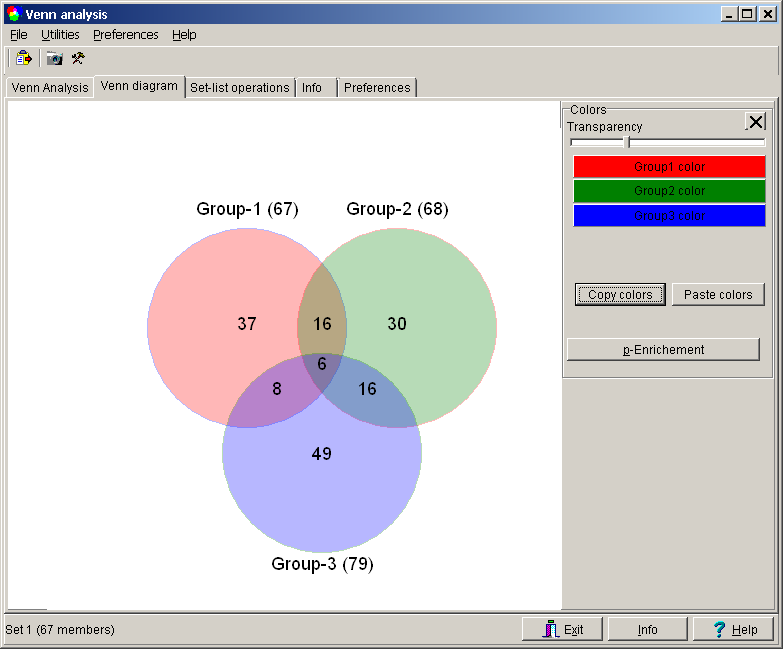
The result is show in a typical Venn diagram:
Size and overlap of circles / ellipses / intersections do not
represent the number of genes.
This is in principle possible with two sets, under lucky
circumstances doeable with three sets but nearly impossible with four or
more sets.
The analysis generates ALL possible intersection sub-sets and intersection which can be generated with
logical AND and AND NOT operations and shows them in the graph.
Lets read the graph:
- Group1 contains a total of 67 genes.
- Group1 has 36 unique genes ( G1 AND NOT G2 AND NOT G3 )
- Group1 shares 16 genes with Group2 not found in Group3 (G1 AND G2 AND NOT G3 )
- Group1 and Group2 share 22 genes (16+6, G1 AND G2)
- Group1 shares 9 genes with Group3 not found in Group2 (G1 AND G3 AND NOT G2)
- Group1 shares 15 genes with Group3 (9+6, G1 AND G3)
- Group1, Group2 and Group3 share 6 overall common genes (G1 AND G2 AND G3)
- ....
Move the mouse across the image.
In status bar is indicated which set you have selected.
E.g. "Set 13-2" means you are looking at subset Group1 AND Group3 AND NOT Group2.
Double-click into a subset to display the corresponding genelist.
Press Ctrl+C or click right mouse button and select Copy list from
the context menu to copy genes contained in the selected sub-set to clipboard.
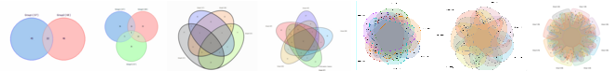
The Venn diagrams:
2-sets:
3 sets:
4 sets:
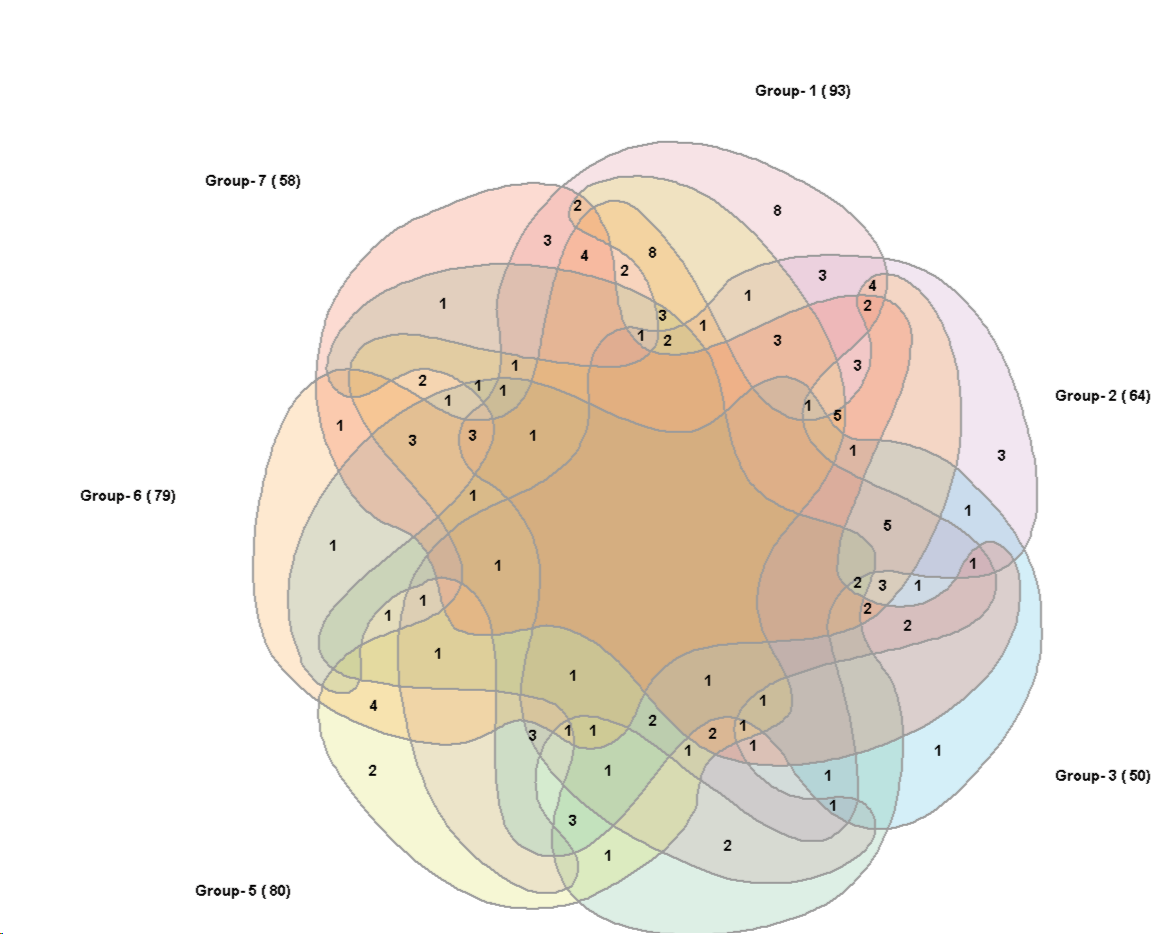
5 sets:
The graph is adopted to the diagram from
Branko Grünbaum, Venn diagrams and Independent Families of Sets, Mathematics Magazine, 48 (Jan-Feb 1975) 12-23
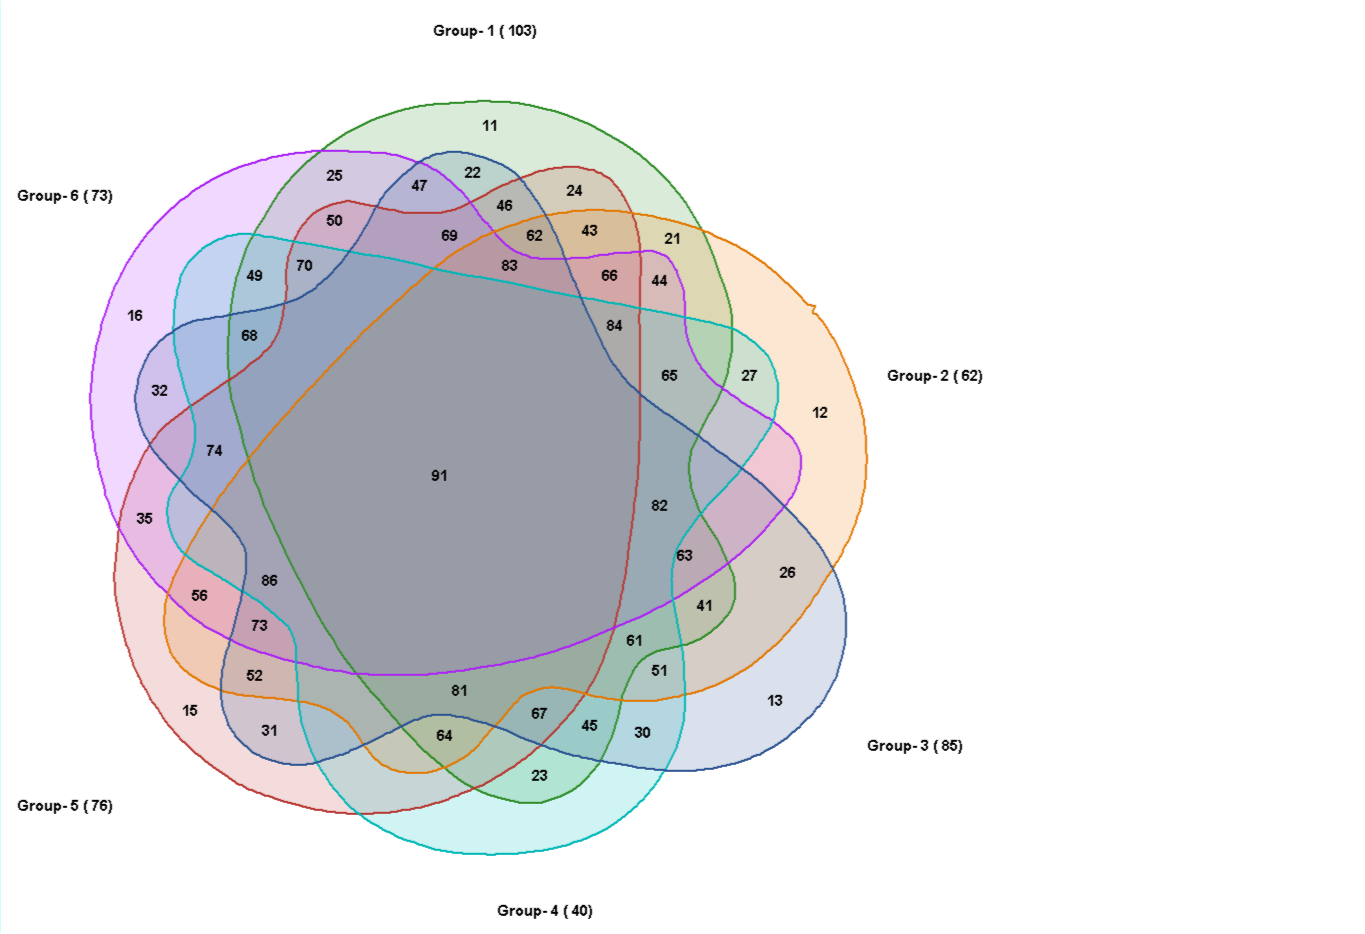
6 sets:
7 sets:
Alternate 7 set graph:
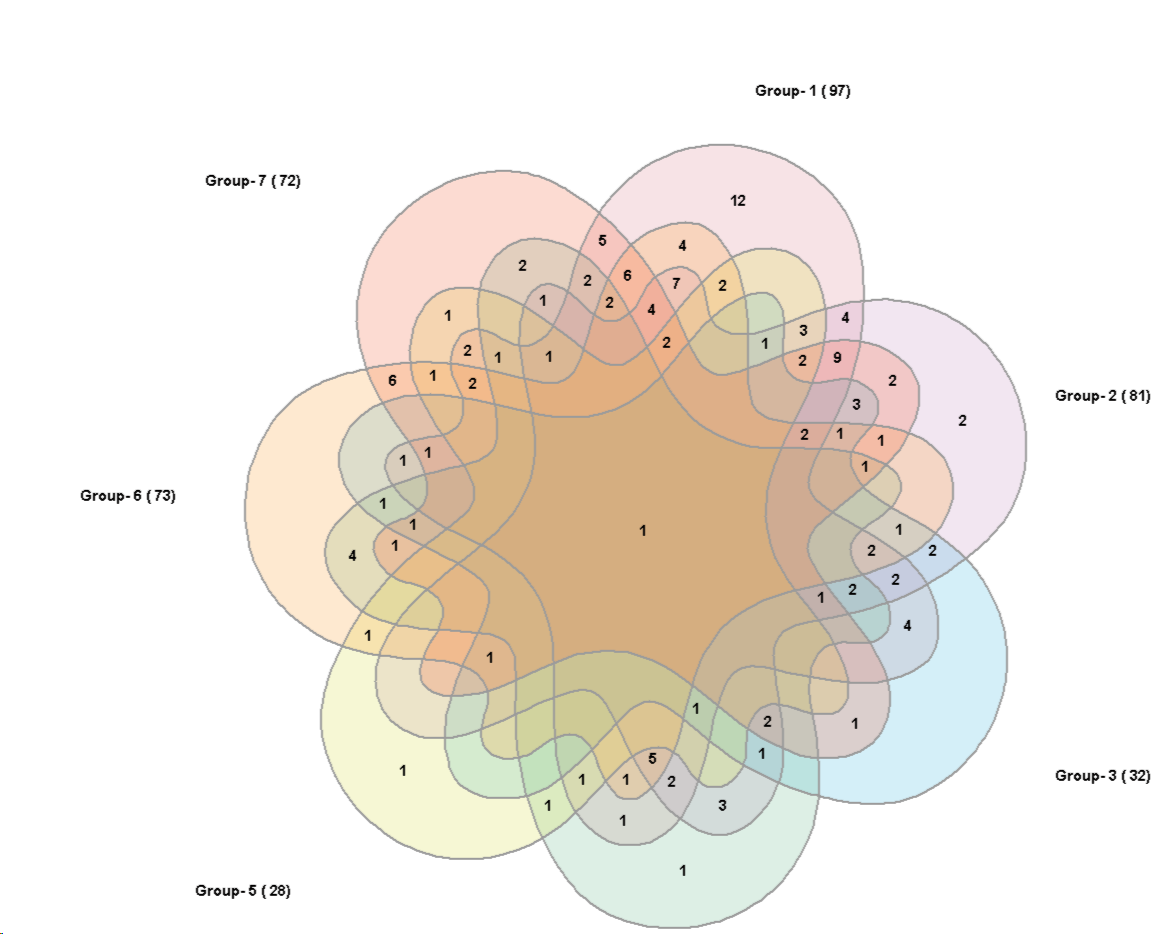
The graphs are adopted to the diagrams from
Anthony Edwards, Adelaidean, News from the University of Adelaide, Vol. 1, No. 11, December 14, 1992 and
Branko Grünbaum, Branko Grünbaum, Venn Diagrams II, Geombinatorics, Volume II, Issue 2, (1992) 25-32
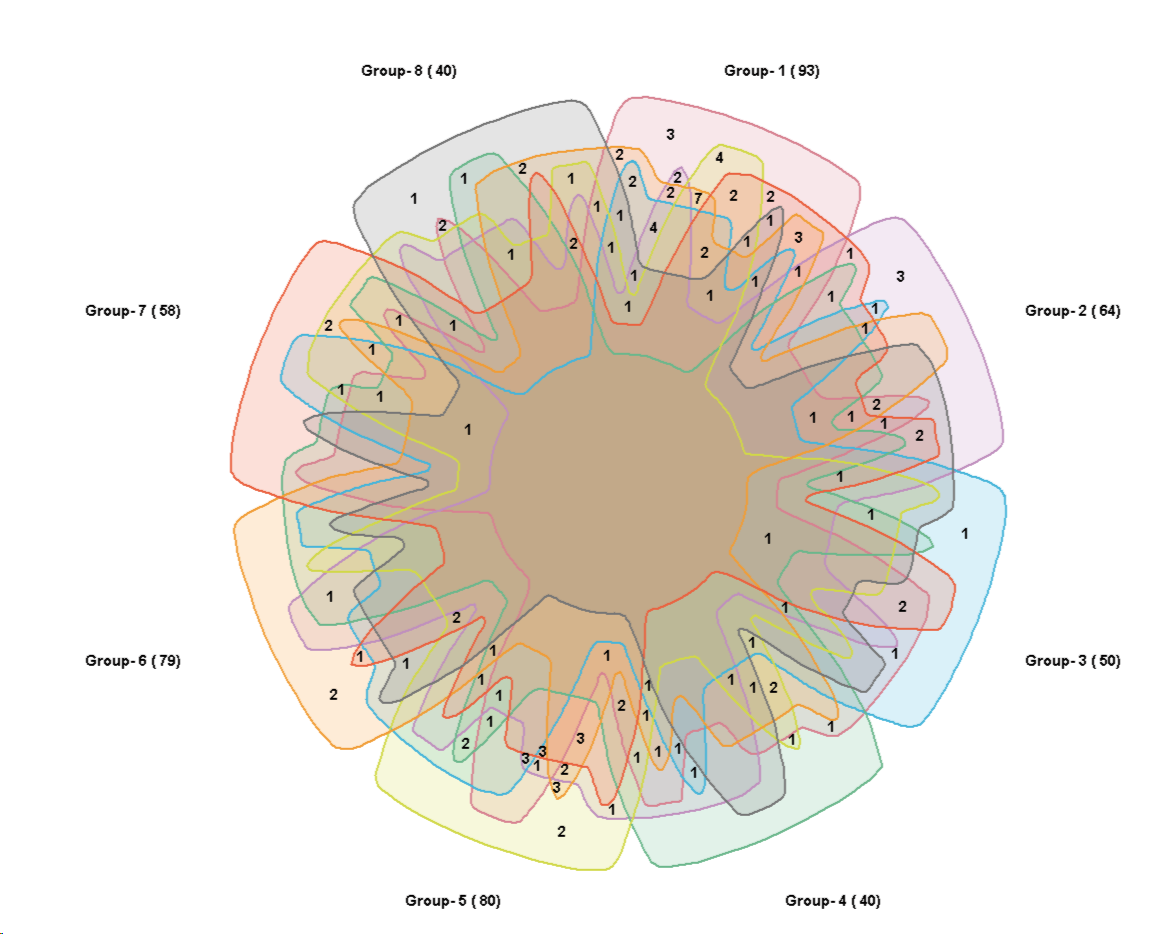
8 sets:
Customize the graph
You may freely change colors.
Open the Tools panel clicking the "Hammer" button in tool bar:
Click any of the Group-Color buttons to select a new color for the respective group.
Adjust the Transparency with the slider
Colors are be defined independant for the different Venn sets.
E.g. Black&White for 2-set Venn.
Red&Green&Blue for 3-set Venn, ...
Actual settings are stored when closing the Venn dialog, and reused for next seesion.
You may Copy colors the present color setting and store them e.g. in a text doucment.
Paste colors a previously saved colorset.
So you may switch between different "color spaces".
Color settings are copied as a list of numbers.
Pair of number (separated by "," for each set.
Transparency,Color pairs for each grop separated by ";".
Color for each group separated by ",".
E.g. the Red&Green&Blue setting for 3set Venn: "1128;255,16711680;32768,255;16711680,32768;"
From Preferences Menu:
- Hide the "O" for empty intersections oi the graph.
- Change the border-color between dimmed group colr, / gray / black.
- width of the border
- Font
- Primaries
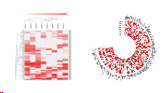
Heatmap views
Venn graphs are impressive and artful.
But:
- They may be misleading: areas in the graph rarely reflect the real number of features in the respective intersection.
- Graphs with >3 groups are hard to digest and interpret
An alternate way for visualization may be heatmaps.
- Each column represents a group.
- Each row a feature.
- As many rows in the heatmap as UNIQUE features derived from ALL groups.
- If a feature is present in a group, the respective heatmap cell is colored.
- It a feautre is missing in a group, the respectiv heatmap cell is left empty.
SUMO adopts the cell color intenity to the total number of hit groups for each feature:
- Feature-x appears in all grousp => cells are stained with bright color.
- feature-y appears pnly in one group => this cell is stained in a pale color.
If you dont like this, just adjust the color *contrast" ruler.
Select
Main menu | Venn => Heatmap
The heatmap-matrix is created and saved in the user's temp folder as "Venn_Heatmap.txt"
and opened in SUMO's heatmap viewer.
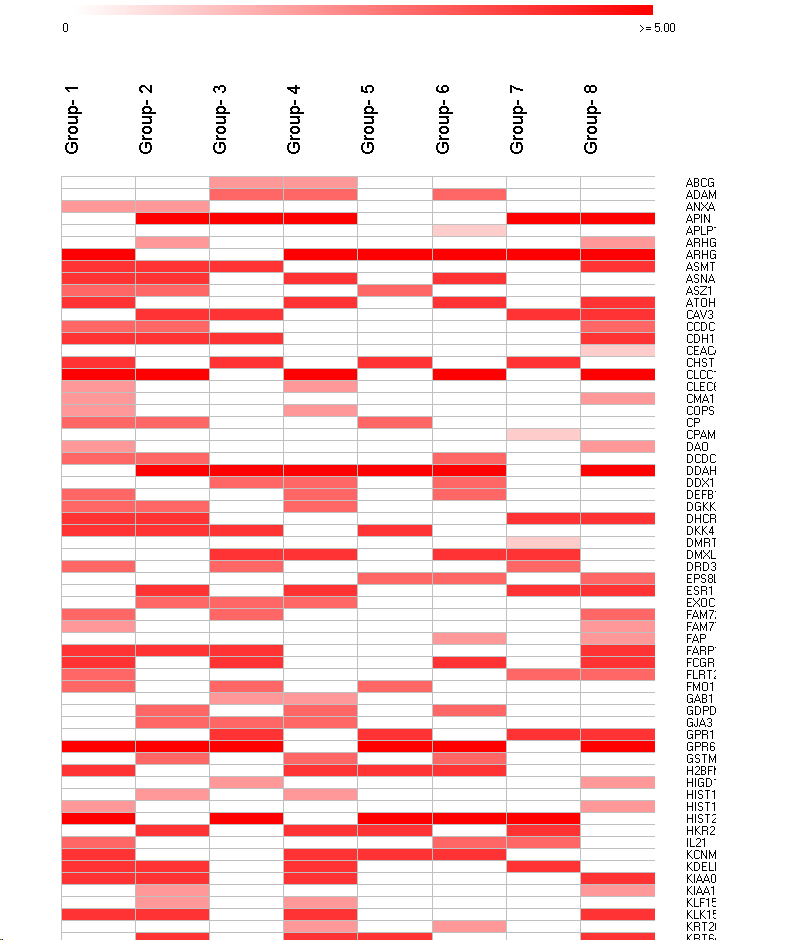
Now you may customize the view, eg, color-scheme, adopt width / heigt of heatmap cells, ...
In particular you might use sorting / clustering to organize features / groups:
Features / groups clusterd with Canberra distance:
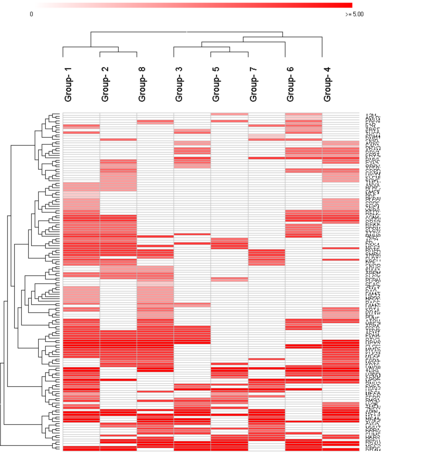
Indicating more intuitively conserved features in a subset of groups.
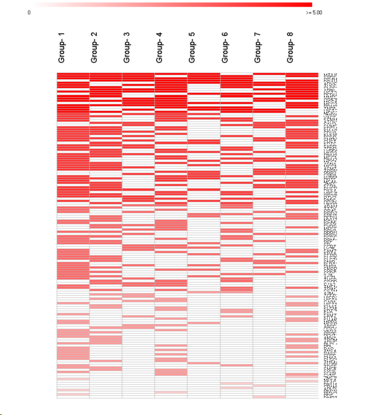
Features sorted by average abundance from all groups:
Circular Heatmap
Select
Main menu | Venn => Circlegrpah
to show a circular heatmap.
A CircleGraph script is created in the user's temp folder
and opened with CircleGraph:
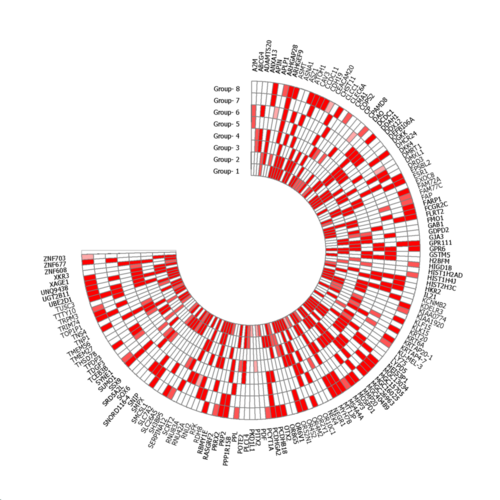
Freely modify the script or add additional feratures to the graph.
See more details here.
p-Enrichement
An obvious question arises: are the intersections between the individual key lists significant or would they occur just by chance?
The Fisher exact test may be applied to estimate the probability for the intersections between the sets.
Basic assumption: all list are selections from the same basic data set (e.g. a genome wide gene expresson array.
Click the p-Erichement button.
Define the number of members in the base popluation.
SUMO computes p-values for all intersections:
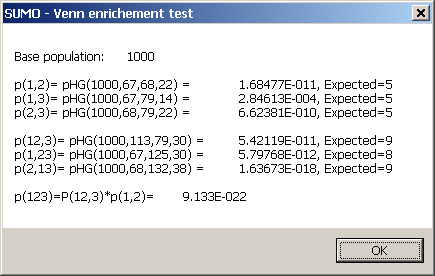
The Expected number is the number of keys in the intersection you would expect, in case all your selection
are just random subsamples from the bse pouplation (0-hypthesis, p-value ~1).
If your intersection is much larger - or much samller - than expected, your intersection is enriched - depleted - (p-value <<1).
A low p-value with larger then expected intersection implies a correlation in the data, and thus even a common causalty.
A low p-value with smaller then expected intersection implies a disconcordance.
In Info-TabSheet you may copy any of the individual p-values:
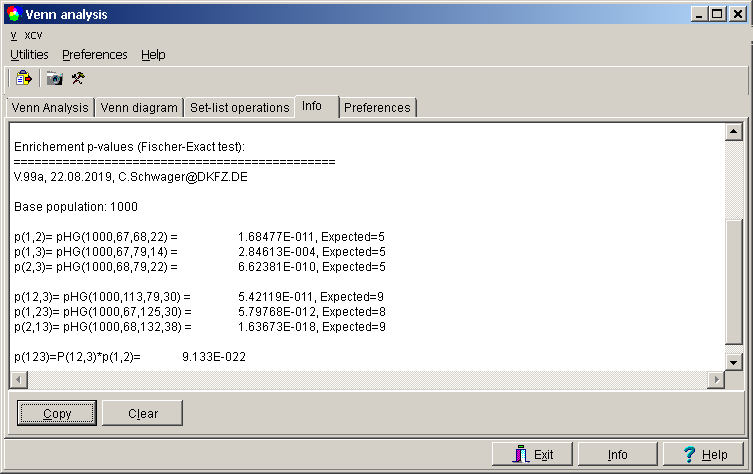
NB: Presently, only 2-set and 3-set diagrams are evaluated.
Preferences
Here you may set some options to adjust program behavior.
Do not check for data files in key lists
If you enter data (especially key names) in the first 20 data lines of the data grid, SUMO will check:
did you define data file names?
This may take some while especially when Windows present dir is a network mapped drive.
To prevent file search, enable this option.
Presorted, non duplicate lists
The first and time cosuming step in Venn analysis is sorting (for faster list comparison) and duplicate removal.
Especially if you are analysing huge lists (ten to hundred thousands of keys).
In case your data are already sorted and deduplicated you may save this additonal processing time.
To prevent sorting/deduplication check this field.
Preferences Tab-sheet: Key divider
By default SUMO applys the common used dividers to split your pasted data into individual search keys.
In case you data contain internally such typical dividers, you may uncheck the repective value.
E.g. Compare a list of names:
Mickey Mouse
Donald Duck
Clarabelle Cow
Horace Horsecollar
...
In this case, it would be beneficial to uncheck the "Space" divider.
List-Venn
In case you want to compare more then six data sets, go to the List-Venn tab-sheet.
How many sets and values per set are possible ?
In principle only limited by computer's main memory.
Dozends of sets with thousands of keys should work easily.
Larger data sets may become time consuming.
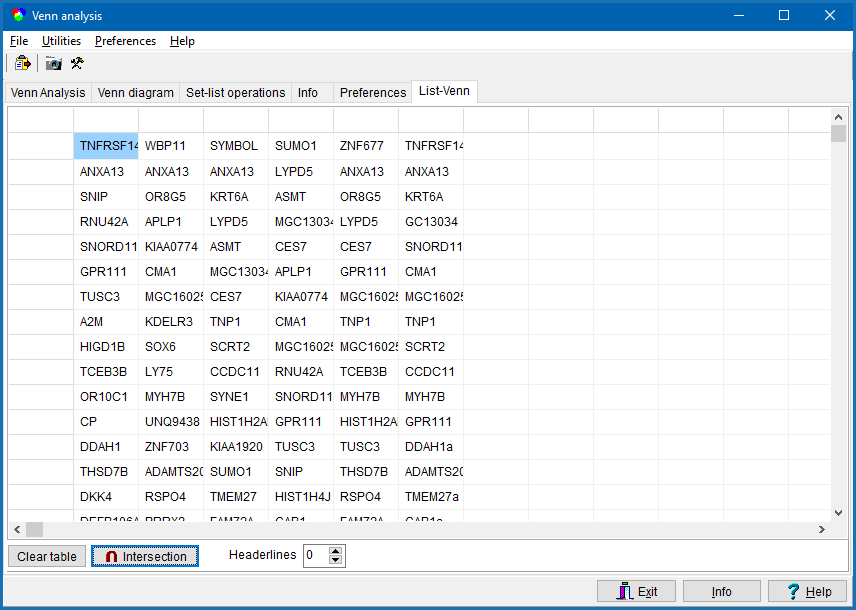
Click into a data colum and paste a NEW-LINE delimited column of key values (e.g. a data column copied out of an EXCEL spread sheet) by Clicking the paste toolbar-button.
Or drag a single (or multiple) key list files from Windows explorer into the tabsheet.
A parameter dialog opens up.
Define the data column in the dropped files which contains the keys.
Keys will be pasted starting from the data colum where files were dropped.
Column header cell will contain name of the dropped file.
Be careful: The order of dropped files may differ from the order how files were selected !!
To re-order columns: Click into a column header and drag the column within the table keeping left mouse-button pressed.
Presently SUMO expects:
- text files with multiple lines
- one line per key
- each line may contain multi "columns" divided by TABs
- define the column containing the keys. All other columns are ignored.
In lines with too few columns, this line will be ignored.
In case imported data contain one (or multiple) headerlines, set the Headerlines field accordingly.
When done with data entering click the Intersection button.
SUMO analyzes:
- Find all unqiue keys from each list (column) independantly.
- Count: how often does each key occur in the respectiv set.
- Build the union of all unique keys from all sets.
- Count for each key: how many of the individual sets contain this key.
- For each key build a text pattern describing in which sets (columns) this key was found.
The result is shown in the List-Venn: Result tab-sheet:
The table contains:
- Column-1: Alphabetically sorted list of unique keys from all sets.
- Column-2: Count, how many of the individual sets contain the key from the repective row.
- Column-3: Ocurrence pattern.
E.g. " ,2,4,8,9,10,11 " indicate: this key was found in data-sets 2,4,8,9,10,11.
- Other columns: Indicate how often this key was keys found in the respective sets.
A Numerical value indicates how often the key is replicated in this respective set.
Empty cell = key not found in this respective set.
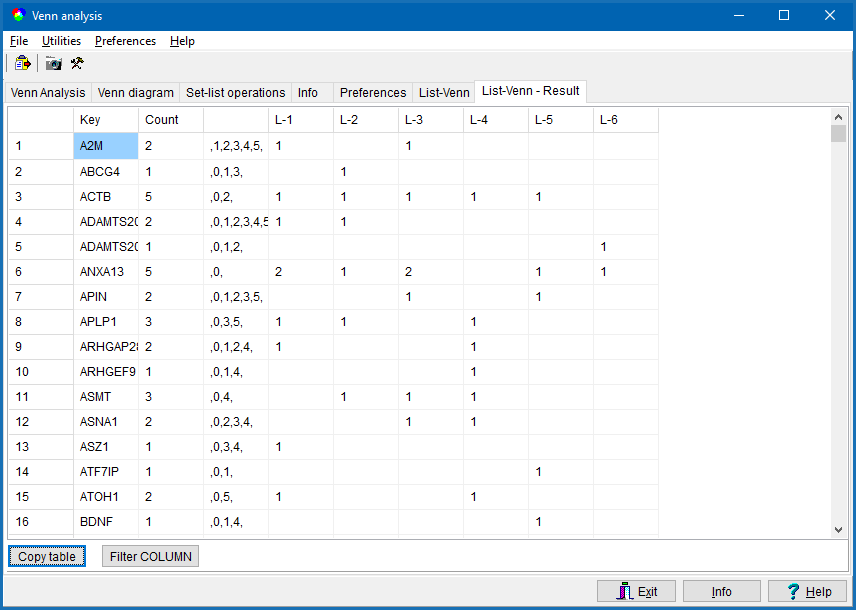
Click the Copy-table button to copy content of the whole table to clipboard.
Click the Filter-COLUMN button, to filter a sub-selection.
A filter parameter dialog opens up:
- Specify table column-ID to be used for filtering,
- Specify filter value
Filter on key
Select Column-ID = 1
Specify one or multiple keys separated by SPACE (e.g. " EGF HPRT") to search for.
By default SUMO checks for partial matches. (e.g. "EGF" matches "EGFR", "VEGF", "VEGFA", ...)
Specify "/pm" to only show Perfec Matches.
E.g. filer for "/pm VEGF" will NOT show VEGFA, VEGFR, ...
Filter on occurence-pattern:
Select Column-ID = 3
Specify one or multiple keys (separated by SPACE (e.g. " ,2, ,3,4, ,5, ,7,") to search for.
Specifying multiple keys (e.g. " ,2,4, ,6, ") search will return ALL rows where ANY of defined paterns shows up:
,1,2,4,5,6,7,8,8.....
,2,4,5,6,
,1,2,4,5,6,
,2,4,6,
,1,3,6,....
,6,8,12,...
,1,2,4,....
....
Define "/and" to force all defined patterns MUST show up:
E.g. "/and ,2,4, ,6, ") search will return ALL rows where ALL of defined paterns shows up:
,1,2,4,5,6,7,8,8.....
,2,4,5,6,
,1,2,4,5,6,
,2,4,6,
....
Specifing a single pattern (e.g. " ,2,4,6, ") only those lines will be reported CONTAINING EXACTLY this pattern.
,1,2,4,6,7,8,9,...
,1,2,4,6,12,20,...
,2,4,6,8,15,...
,2,4,6,
...
Like above specify "/pm ,2,4,6," will ONLY reply keys found in sets 2 AND 4 AND 6.
Filter on abundance:
Select Column-ID = 2 or Column-ID ≥= 4.
Specify a numerical threshold (e.g. " 3 ").
Only those rows are reported where the abundance value from the respective column is larger or equal the defined threshold.
In any case a list of found matching items is returned and shown in the Info tab-sheet as well as directly copied to Clipboard.