3D-ScatterPlot - Controls
The 2D-projection of 3D-data cloud is sometimes irritating or makes it difficult to recognize inherent structure.
Obviously, rotating of the cloud will help to analyze the data.
Intuitively, hold left mouse-button pressed and move the mouse within 3D-ScattePlot's window.
Now you can freely rotate the data cloud and try to recogize and understand sub-structures in the data.
Toolbar
 Zoom the graph in ("+") or out ("-").
 Rotate the graph stepwise over the axis (x,y,z) in distinct steps forward/backwards.
 Move the graph step wise left/right, up/down within the window.
 Show/hide coordinate planes for the three axis.
 In case you have only positive coordinates for x,y,z you may show only the first octant of the graph.
If you now rotate the graph, it will rotate around the centre of the octant.
 Reduce graph to 2D projection.
Other data (size,color,symbol) are still visible.
 Take a snapshot of the graph and copy to clipboard.
Shift + Button: Save the snapshot as BMP-pixel / SVG-vector graphics file.
 Assign selected datapoints to a group.
Shift + Button: additionally adjust group settings: symbol, color, size, ...
 Remove all groups.
 Customize group settings.
 Auto-rotate the graph over X/Y axes at highest speed.
 Record an auto-rotated animation as animated GIF, or uncompressed avi file.
The nimation tries to capture complete (360°) rotaton over X/Y-axes.
Recording may be slow, see progress in titlebar.
Speed of the animations is limited.
But you may "accelerate" the animated gif - see SUMO Main menu | Utilities | Animated GIF.
Control tool-window
Here you can controls many aspects hot data are displayed.
Select Main main | Controls top open the control tool-window:
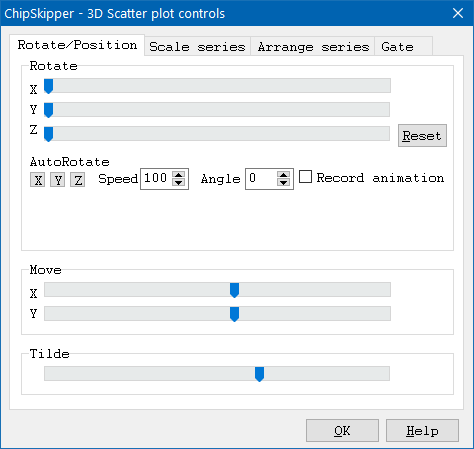
Rotate position tab-sheet
Use the X / Y / Z sliders to rotate the graph desitinctively around any of three axes.
Click the Reset to set all three Rotate-slider to start position.
Click the AutoRotate X / Y / Z buttons to automatically rotate the graph around any of the selcted axes - either single or any combination.
Adjust the rotation Speed by defining the delay between rotation increments.
As smaller the value as faster the rotation.
Adjust the auto-rotation Angle.
The default value "0" results in a continuous rotation in one direction.
Define any value (e.g. "90") to rotate the graph 90 degrees forward - backward.
Use the Move sliders to move the graph within the window.
Use the Tilde silder to adjust the obersation angle for the 3D => 2D projection.
Scale series tab-sheet
Here you may set dcaling parameters for each of the displayed data series independantly:
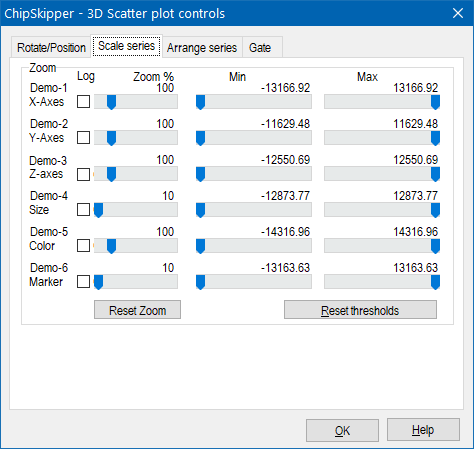
Click the Log check-box to show data for the respective axis Log10 transformed.
Values ≤ 0 are converted to 0.
Adjust the Zoom slider to zoom axes indivudally.
Adjust Min / Max threshold to hide data points with values beyond the threshold for the repective axes.