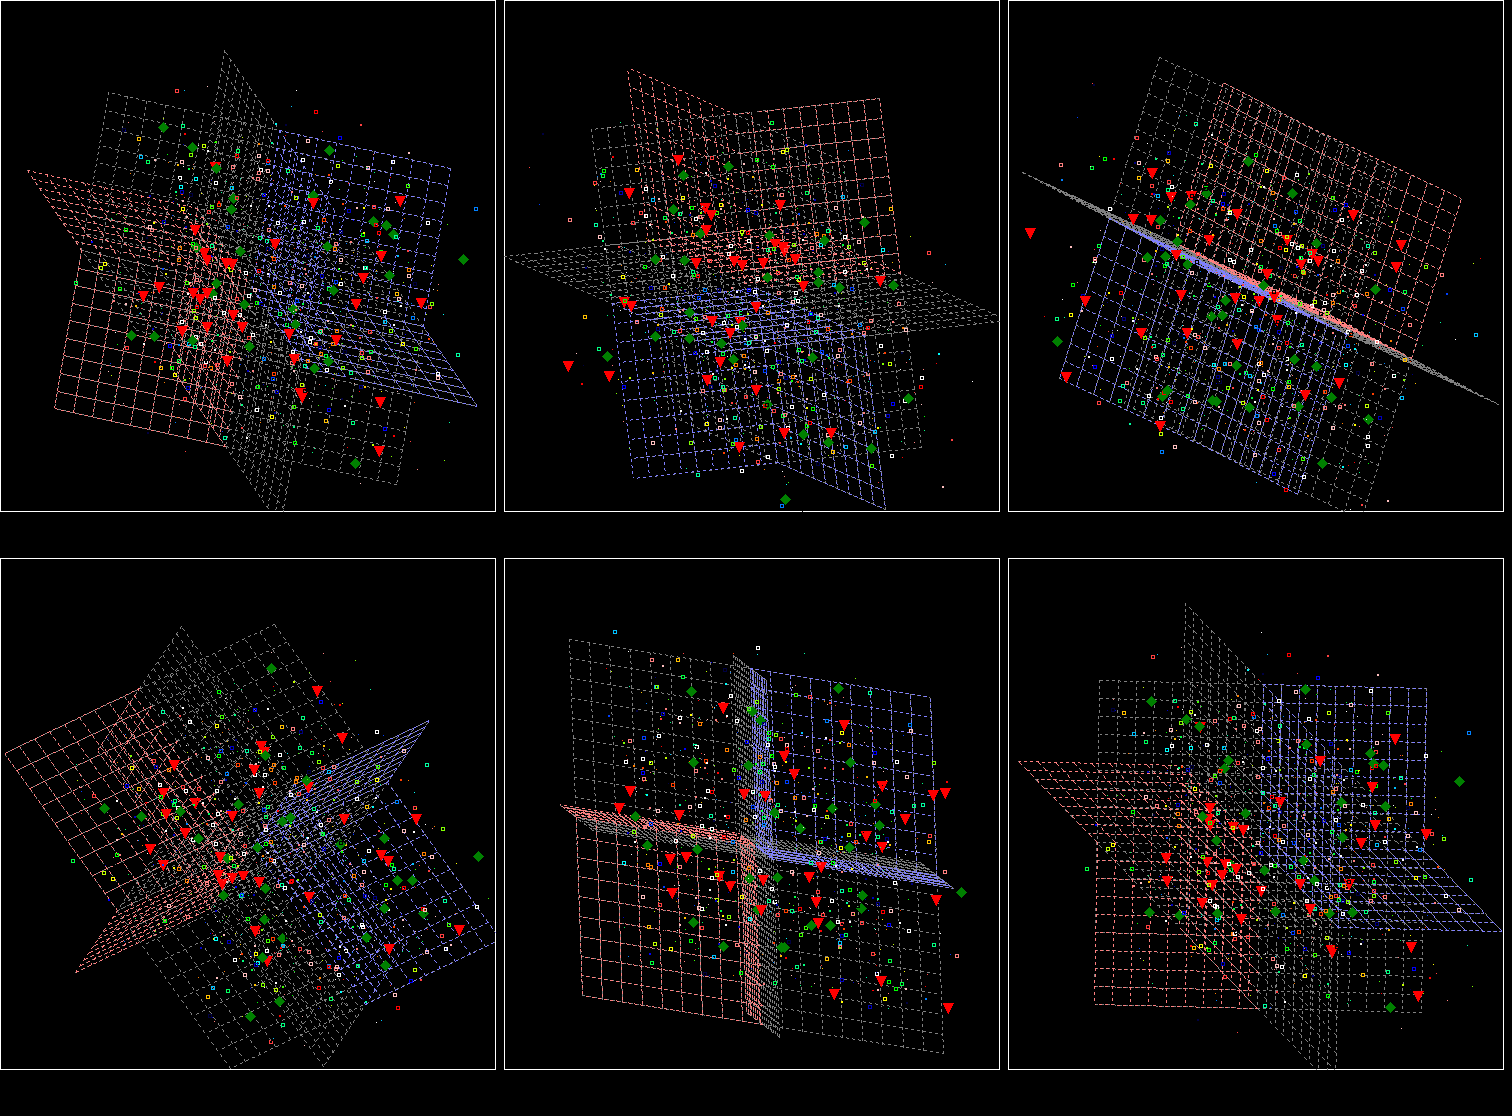
SUMO - 3D-Scatterplot viewer
A 3D-Scatterplot is a generic plot or mathematical diagram using Cartesian
coordinates to display values for typically three variables for a set of data as a 2D-projection.
The data is displayed as a collection of points, each having the value of one variable determining the
position on the X-,Y- and Z-axes.
Additonally, three complementary values for each point may be displayed as symbol size, symbol color oy symbol type.
Furthermore, data labels for each point may be shown.

For detailed analysis of data structure, the graph may be freely rotated over all axes, scaled and thresholded interactively.
Originally, Scatterplot-Viewer is called from SUMO's Data/View sub-menu, or as dedicated data viewer (e.g. PCA).
But you may run the viewer stand alonne (SUMO main menu | Utilities | 3D-Scatterplot) and open/import tab delimited data files or copy/paste data from clipboard.
Scatterplot viewer is part of the SUMO package.
3D-Scatterplot doesn't require DirectX of OpenGL drivers to be availalbe in your system.
