| feature=type:radius;xxxx,y1,y2 |
|
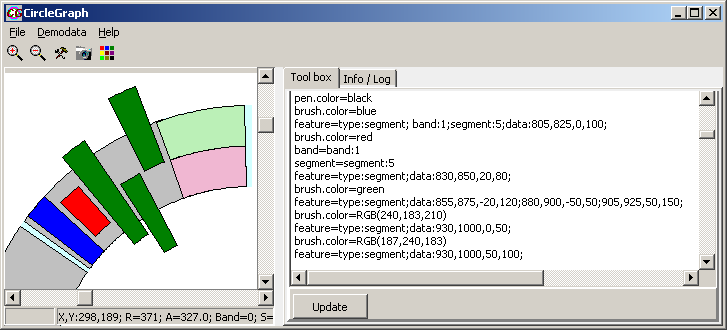
| feature=type:segment;x1,x2,y1,y2;x1,x2,y1,y2;... |
|
| feature=type:text;xxxx,yyyy,The text |
|
| Command | |
|---|---|
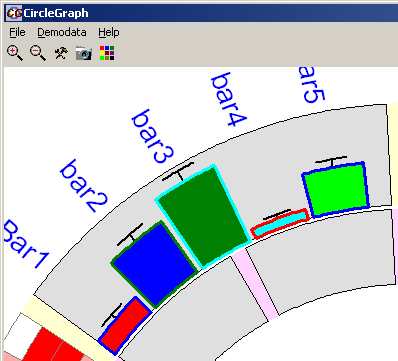
| feature=type:barseries | This will start the definition of a barseries. All following commands will be interpreted as bar-series commands, until a "end-block" command is given: "//" |
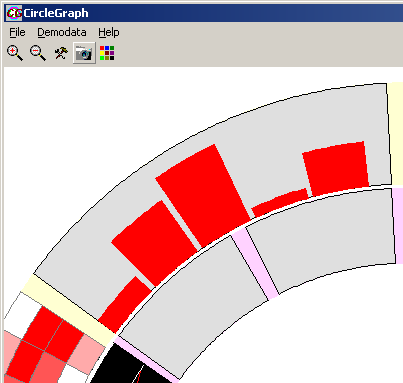
| type=y,error,color | Define how data tuples are interpreted: - y = only bars: list of semi-colon separated values for several bars (e.g. "12;23;89;16;") - y,error = bars and error: list of semi-colon separated value pairs of "value,error" (e.g. "12,1.3;25,4.2;40,4;" ) - y,color = value and color: list of semi-colon separated value triples of "value,brushcolor,pencolor" (e.g. "12,Red,green;25,blue,red;40,yellow,navy;" ) if second color value missig => pen-color=brushcolor - y,error,color = value,error and color: list of semi-colon separated value quadruplets of "value,error,brushcolor,pencolor" (e.g. "12,2.1,Red,green;25,4.6,blue,red;40,8,yellow,navy;" ) if second color value missig => pen-color=brushcolor Alternatively, you may the different values as separate values lists. You may append (separated by colon) an optional name for the individal bar: 12,Bar1;24,Bar2;43;bar3; ... |
| ydata=4;8.5;12;24;4; | List of semi-colon separated values |
| yerror=1.4;4.8;4.12;4.5;2; | List of semi-colon separated values. Error must match above list of data values. Additional error data are ignored, missing value are set to zero. |
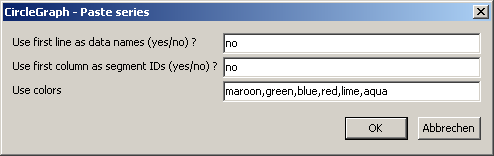
| colors=red;green;blue;lime;aqua; | List of semi-colon values for brush- AND pen-color of indivual bars. Colors MUST match above list of data values. Additional color values are ignored. If to few color values are used defined ones are recycled. |
| brushcolors=red;green;blue;lime;aqua; | List of semi-colon values for brush color of indivual bars. Colors MUST match above list of data values. Additional color values ...... |
| pencolors=red;green;blue;lime;aqua; | List of semi-colon values for pen color of indivual bars. Colors MUST match above list of data values. Additional color values ..... |
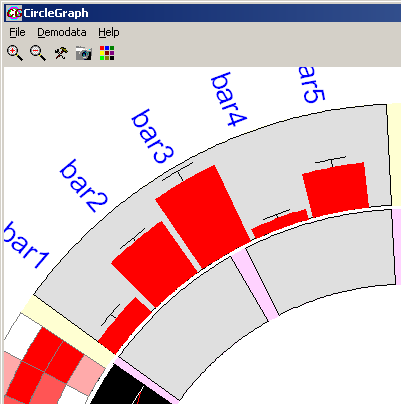
| Names=Bar1;Bar2;Bar3;Bar4;Bar5; | List of semi-colon seperated Names for the individual bars. Names MUST match above list of data values. Additional names are ignored. Names are plotted in radial directon on top of the target segment centered to the respective bars. Obviouisly, the names should not contain a semi color. |
| yscale=min,max | Define custom data scaling range |
| barspacer=xxx | Define distance between bars, as fraction of barwidth: - barspacer=0 : no distance, bars are touchning - barspacer=0.5 : distance=width of bar |
| error.color=black | Define the color for error bars, independant from the global pen-color |
| error.width=2 | Define the pen width for error bars, independant from the global pen-width |
| box1=4;8.5;12;24;4; | List of semi-colon separated values for lower Box value. |
| box2=8;17;24;48;8; | List of semi-colon separated values for higher Box value. |
| whisker1=2;4;6;12;2; | List of semi-colon separated values for lower Whisker value. |
| whisker2=12;23;30;60;10; | List of semi-colon separated values for lower Whisker value. |
| Command | |
|---|---|
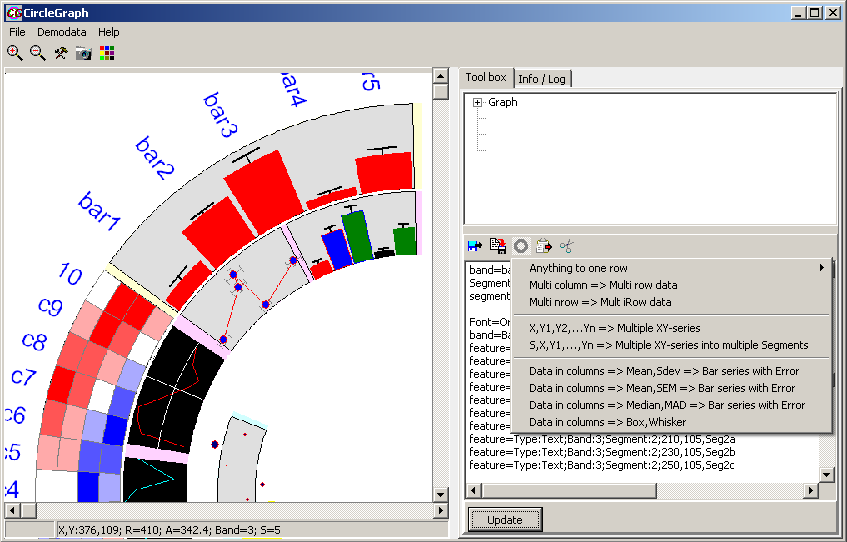
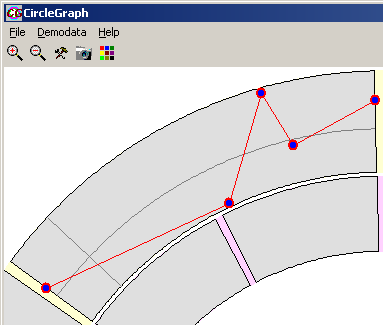
| feature=type:xyseries | This will start the definition of a xy-series. All following commands will be interpreted as xy-series commands, until a "end-block" command is given: "//" |
| ydata=4;8.5;12;24;4; | List of semi-colon separated values for y-coodinates of the data points. You may have multiple "xdata" command. Respective data are just appended to the already exisiting data. Required !! For test purposes you may generate a random data set: ydata=simulate;random;Min;Max;Number; E.g. "ydata=simulate;random;-3;3;100" would generate 100 random datapoints between -3..3 |
| xdata=4;8.5;12;24;4; | List of semi-colon separated values for x-coordinate of the data points. X-values MUST match order of Y-calues !! If not supplied, data-points are fitted into the target segement at equal distances. |
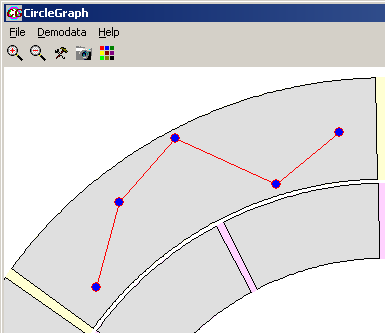
| yerror=4;8.5;12;24;4; | List of semi-colon separated error of y-coodinates for the data points. Y-errors MUST match order of Y-values !! Optional. |
| xerror=4;8.5;12;24;4; | List of semi-colon separated error of x-coodinates for the data points. X-errors MUST match order of X-values !! Optioonal. |
| colors=red;green;blue;lime;aqua; | List of semi-colon values for brush- AND pen-color of indivual bars. Colors MUST match above list of y-values. Additional color values are ignored, missing values are to black. Not yet available. |
| bruscolors=red;green;blue;lime;aqua; | List of semi-colon values for brush color of indivual points. Colors MUST match above list of y-values. Additional color values are ignored, missing values are to black. Not yet available. |
| pencolors=red;green;blue;lime;aqua; | List of semi-colon values for pen color of indivual data points. Colors MUST match above list of y-values. Additional color values are ignored, missing values are to black. Not yet available. |
| Names=Bar1;Bar2;Bar3;Bar4;Bar5; | List of semi-colon seperated Names for the indivual data points. Names MUST match above list of y-values. Additional names are ignored, missing Names are skipped. Names are plotted in radial directon on top of the target segment centgered to the respective bars. Obviouisly, the names shold not contain a semi color. |
| yscale=min,max | Define custom data scaling range in y-dimension (radius) |
| xscale=min,max | Define custom data scaling range in x-dimension (angle) |
| error.pen.color=black | Define the color for error bars, independant from the global pen-color |
| error.pen.width=2 | Define the pen width for error bars, independant from the global pen-width |
| error.size=xxx | Define the size of the error end markers in pixel. Default=5. |
| marker.show=true / false | Switch on (=true) / off (=false) display of markers for the individual data ponits. Default=true. |
| lines.show=true / false | Switch on (=true) / off (=false) display of connecting lines between the individual data ponits. Default=true. |
| lines.steps=true / false | Switch on (=true) / off (=false) display of connecting lines as STEP function instead of direct point-point connections. Default=false. |
| marker.size=xxx | Define size for all marker (default=5) |
| marker.pen.width=xxx | Define pen width for all marker (default=2) |
| marker.pen.color=Color | Define pen color for all marker independent from global pen-color Default is global pen-color, |
| marker.brush.color=Color | Define brush color for all marker independent from global pen-color Default is global brush-color. |
| Command | |
|---|---|
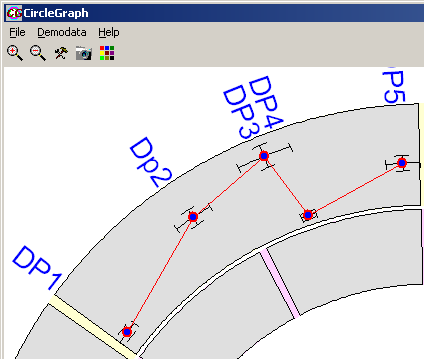
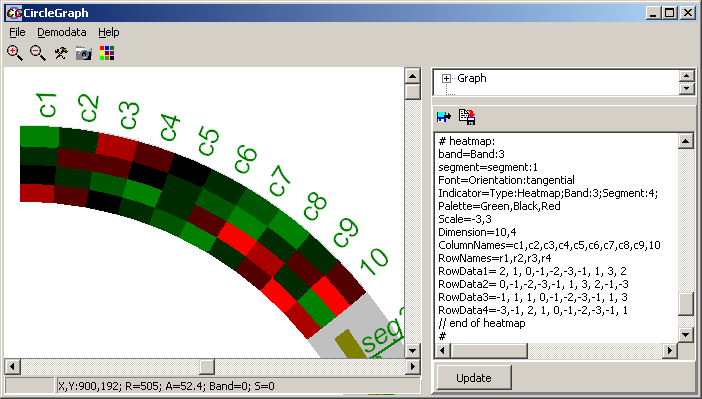
| feature=type:heatmap | This will start the definition of a heatmap. All following commands will be interpreted as heatmap commands, until a "end-block" command is given: "//" |
| Dimension=x,y | Dimension of the heatmap: - x : number of data columns - y : number of data rows Lateron non supplied values will be set zo Zero Lateron additonally supplied values will be ignored. Required !! Define the heatmap dimensions prior to any other parameters ! |
| Palette=Min,Mid,Max | Define the color palette to stain values. For signed values, all three parameters are used. For unsigned (positive values) only Mid and Max are used. E.g. "Green,Black,Red": - negative values will be show in shades of green, - positive values in red - values ~0 in black. You may use the fixed color values or RGB(r,g,b) color definition. By default a "Green,Black,Red" palette is used. |
| Scale | Define the color scale for the displayed heatmap. E.g. "scale=3-,3": - All values <=3 are given bright green, - value >=3 bright red, other values are linearly mapped to shades of green and red By default a "-3,3" sclae is used. |
| ColumnNames=C1;C2;C3;C4,... | Define a list of column names (semi-colon separated). If defined, they will be displayed on top of the heatmap, using presently defined font. |
| RowNames=R1,R2,R3,R4,... | Define a list of row names (semi-colon separated). If defined, they will be displayed on left of the heatmap. |
| cellborder=true | Draws a border around each individual tile/data cell, using presently defined pen-color, pen-width |
| RowDataX=yy;yy;yy;yy;.... | list (semi-colon separated) of numercical values for the heatmap For each Row within the heatmap, supply a RowDataX command. - RowData1 for the first heatmap row, - RowData2 for the second heatmap row - ... Missing rows/data values are set to Zero Superficial Rows/data values are ignored. |
| font=color:colorvalue | Define color for column/row header in heatmap. |
| font=Size:xx | Define font size for column/row header in heatmap. |
| pen.color=color:colorvalue | Define color for cell border - if activated. |
| // ccccccc | "//" terminates the heatmap command block You may append any comment Required !! |
| Command | |
|---|---|
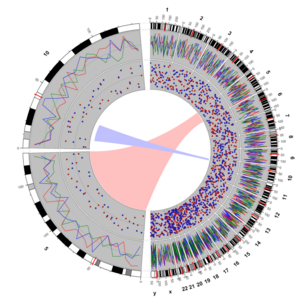
| feature=type:connector | This will start the definition of a connector. All following commands will be interpreted as connector commands, until a "end-block" command is given: "//" |
| type=nnnnn,p1,p2 | Defines the type of connector:
|
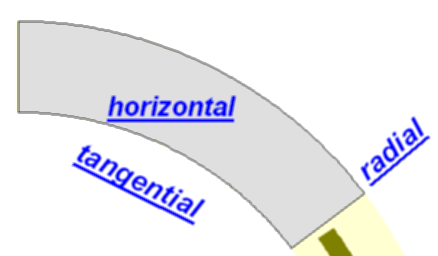
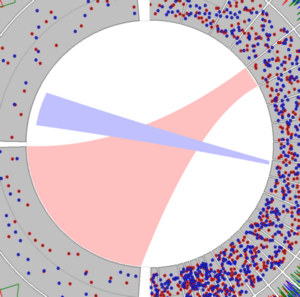
| source=b,s,p1,p2 | Defines the Source of your connector: - b : ID of band where connector should start. Required - s : ID of segment where connector should start Required - p1 : Start (x-/angular) position on source segment. Optional - p2 : End (x-/angular) position on source segment. Optional If neither P1/P2 are defined, the whole segments range will be used (red connector in example). Otherwise you may define the sub-region P1-P2 as start of the connecor (blue connector in the example. If only P1 is defined the source region will the position P1 ( i.e. P2==P1) Required |
| source=b,s,p1,p2 | Defines the Target of your connector: - b : ID of band where connector should end. Required - s : ID of segment where connector should end Required - p1 : Start (x-/angular) position on target segment. Optional - p2 : End (x-/angular) position on target segment. Optional If neither P1/P2 are defined, the whole segments range will be used (red connector in example). Otherwise you may define the sub-region P1-P2 as end of the connecor (blue connector in the example. If only P1 is defined the target region will the position P1 ( i.e. P2==P1) Required |
| anchordistance=d1,d2 | Defines the Gap ( in pixel) between the connector and the Source/target segment. - d1 : Distance at source. - d2 : Distance at target. For "in" connectors, supply negative values, for "out" connectors positive values If only d1 is supplied, d2==d1 Default: if not defined, d1=d2=-5 Optional |
| taille=t | Defines how slim your connector will be compared to a straight trapez. 0 - no taille => straight trapez 0.5 - narrow to 1 pixel at the support points. Default: 0.1 Optional |
| supportposition=p | Defines at which fraction between Source and Target the taille is applied. Default: 0.3 Optional. Taille and Supportposition may be used to modulate the shape of the polygonal connector. If wrongly selected/combined they may generate bizarre forms. |
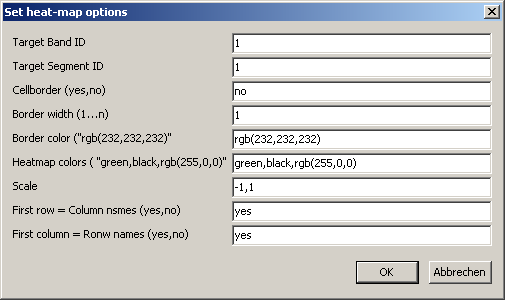
| Target Band ID | ID of the band where the heat-map will show up. Leave empty to omit this scrip line. |
| Target Segment ID | ID of the band where the heat-map will show up. Leave empty to omit this scrip line. |
| Cell border | Show (=yes) or hide (=no) cell borders |
| Border width | Width of pen for painting cell boders. |
| Border color | Pen color for border. Either a fixed or RGB color value. |
| Heatmap colors | Color range from Min->Zero->Max color value |
| Scale | Define a custom Min/Max value for Data=>Color mapping in heatmap. Leave empty to autoscale. |
| First row = Column names | Use first copied data row as columns names (=yes). |
| First column = Row names | Use first cell from copied data rows as row names (=yes). |
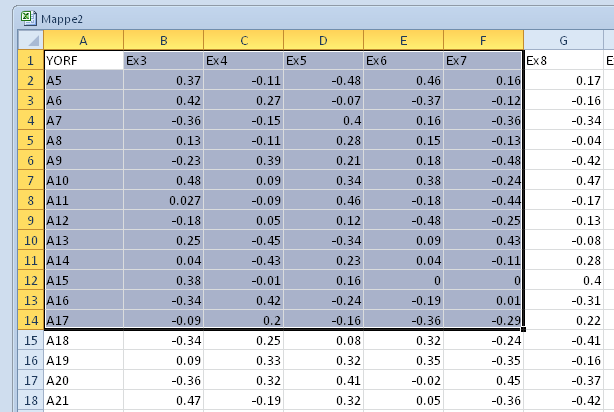
Band=Band:1
Segment=Segment:1
Feature=Type:heatmap
ColumnNames=Ex3;Ex4;Ex5;Ex6;Ex7;
Palette=green,black,rgb(255,0,0)
Scale=-1,1
Dimension=5,13
RowNames=A5;A6;A7;A8;A9;A10;A11;A12;A13;A14;A15;A16;A17;
RowData1=0.37;-0.11;-0.48;0.46;0.16
RowData2=0.42;0.27;-0.07;-0.37;-0.12
RowData3=-0.36;-0.15;0.4;0.16;-0.36
RowData4=0.13;-0.11;0.28;0.15;-0.13
RowData5=-0.23;0.39;0.21;0.18;-0.48
RowData6=0.48;0.09;0.34;0.38;-0.24
RowData7=0.027;-0.09;0.46;-0.18;-0.44
RowData8=-0.18;0.05;0.12;-0.48;-0.25
RowData9=0.25;-0.45;-0.34;0.09;0.43
RowData10=0.04;-0.43;0.23;0.04;-0.11
RowData11=0.38;-0.01;0.16;0;0
RowData12=-0.34;0.42;-0.24;-0.19;0.01
RowData13=-0.09;0.2;-0.16;-0.36;-0.29
// end of heatmap