| Key | Value | Example | |
|---|---|---|---|
| Face | Font_name | Any font available in your system | Face:Arial |
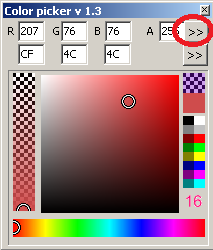
| Color | Color of the font. Any color definition (see above) | Color:rgb(255,128,64) | |
| Size | xx | Size of font | Size:16 |
| Bold | true or false | Switch on/off bold font Without argument always swithces on. Instead of True/False you may use abbreviated T/F | Bold:true |
| Italic | true or false | Switch on/off italic font | Talic |
| Underline | true or false | Switch on/off underline font | UNderline:false |
| StrikeOut | true or false | Switch on/off Strikeout font | Strikeout:t |