CircleGraph
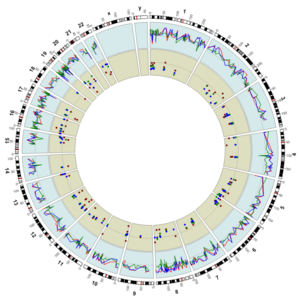
CircleGraph is a generic tool to visualize complex related data in a circular plot.
Imagine you want to show various genetic features located on the human genome.

- The circle represents the whole genome.
- Various cicular bands show different information, e.g.:
- Chromosomal G-banding
- Position of Single Nucleotide Poymprphisms and theit type (insertion,Deletion,Base exchange)
- Position of CpG islands
- Profile of (averaged) methylation)
- ...
- Bands may be structured into segments (e.g. individual chromosomes)
- Features may pe plotted into the segments
- Bars with defineable width and height
- Position markers
- Profiles
- Text
- heatmaps
- ...
- and more ...
Scripts, descibing the graph with easy to understand commands may be created with any text editor - or the integrated one.
Some features may be adjusted interactively with the GUI
Graphs may be saved as image files with customized size and resolution.
CircleGraph is a native 64-bit Windows application, implemented with Embarcaderos Deplph XE3.
It may be executed on any 64-bit MS-Windows compatible OS, e.g. Windows7/8/10 or Linux (with the WineHQ comatibility layer application).
CircleGraph may be freely downloaded for personal use.
