CircleGraph - Example graphs
A view examples of graphs generated with CircleGraph.
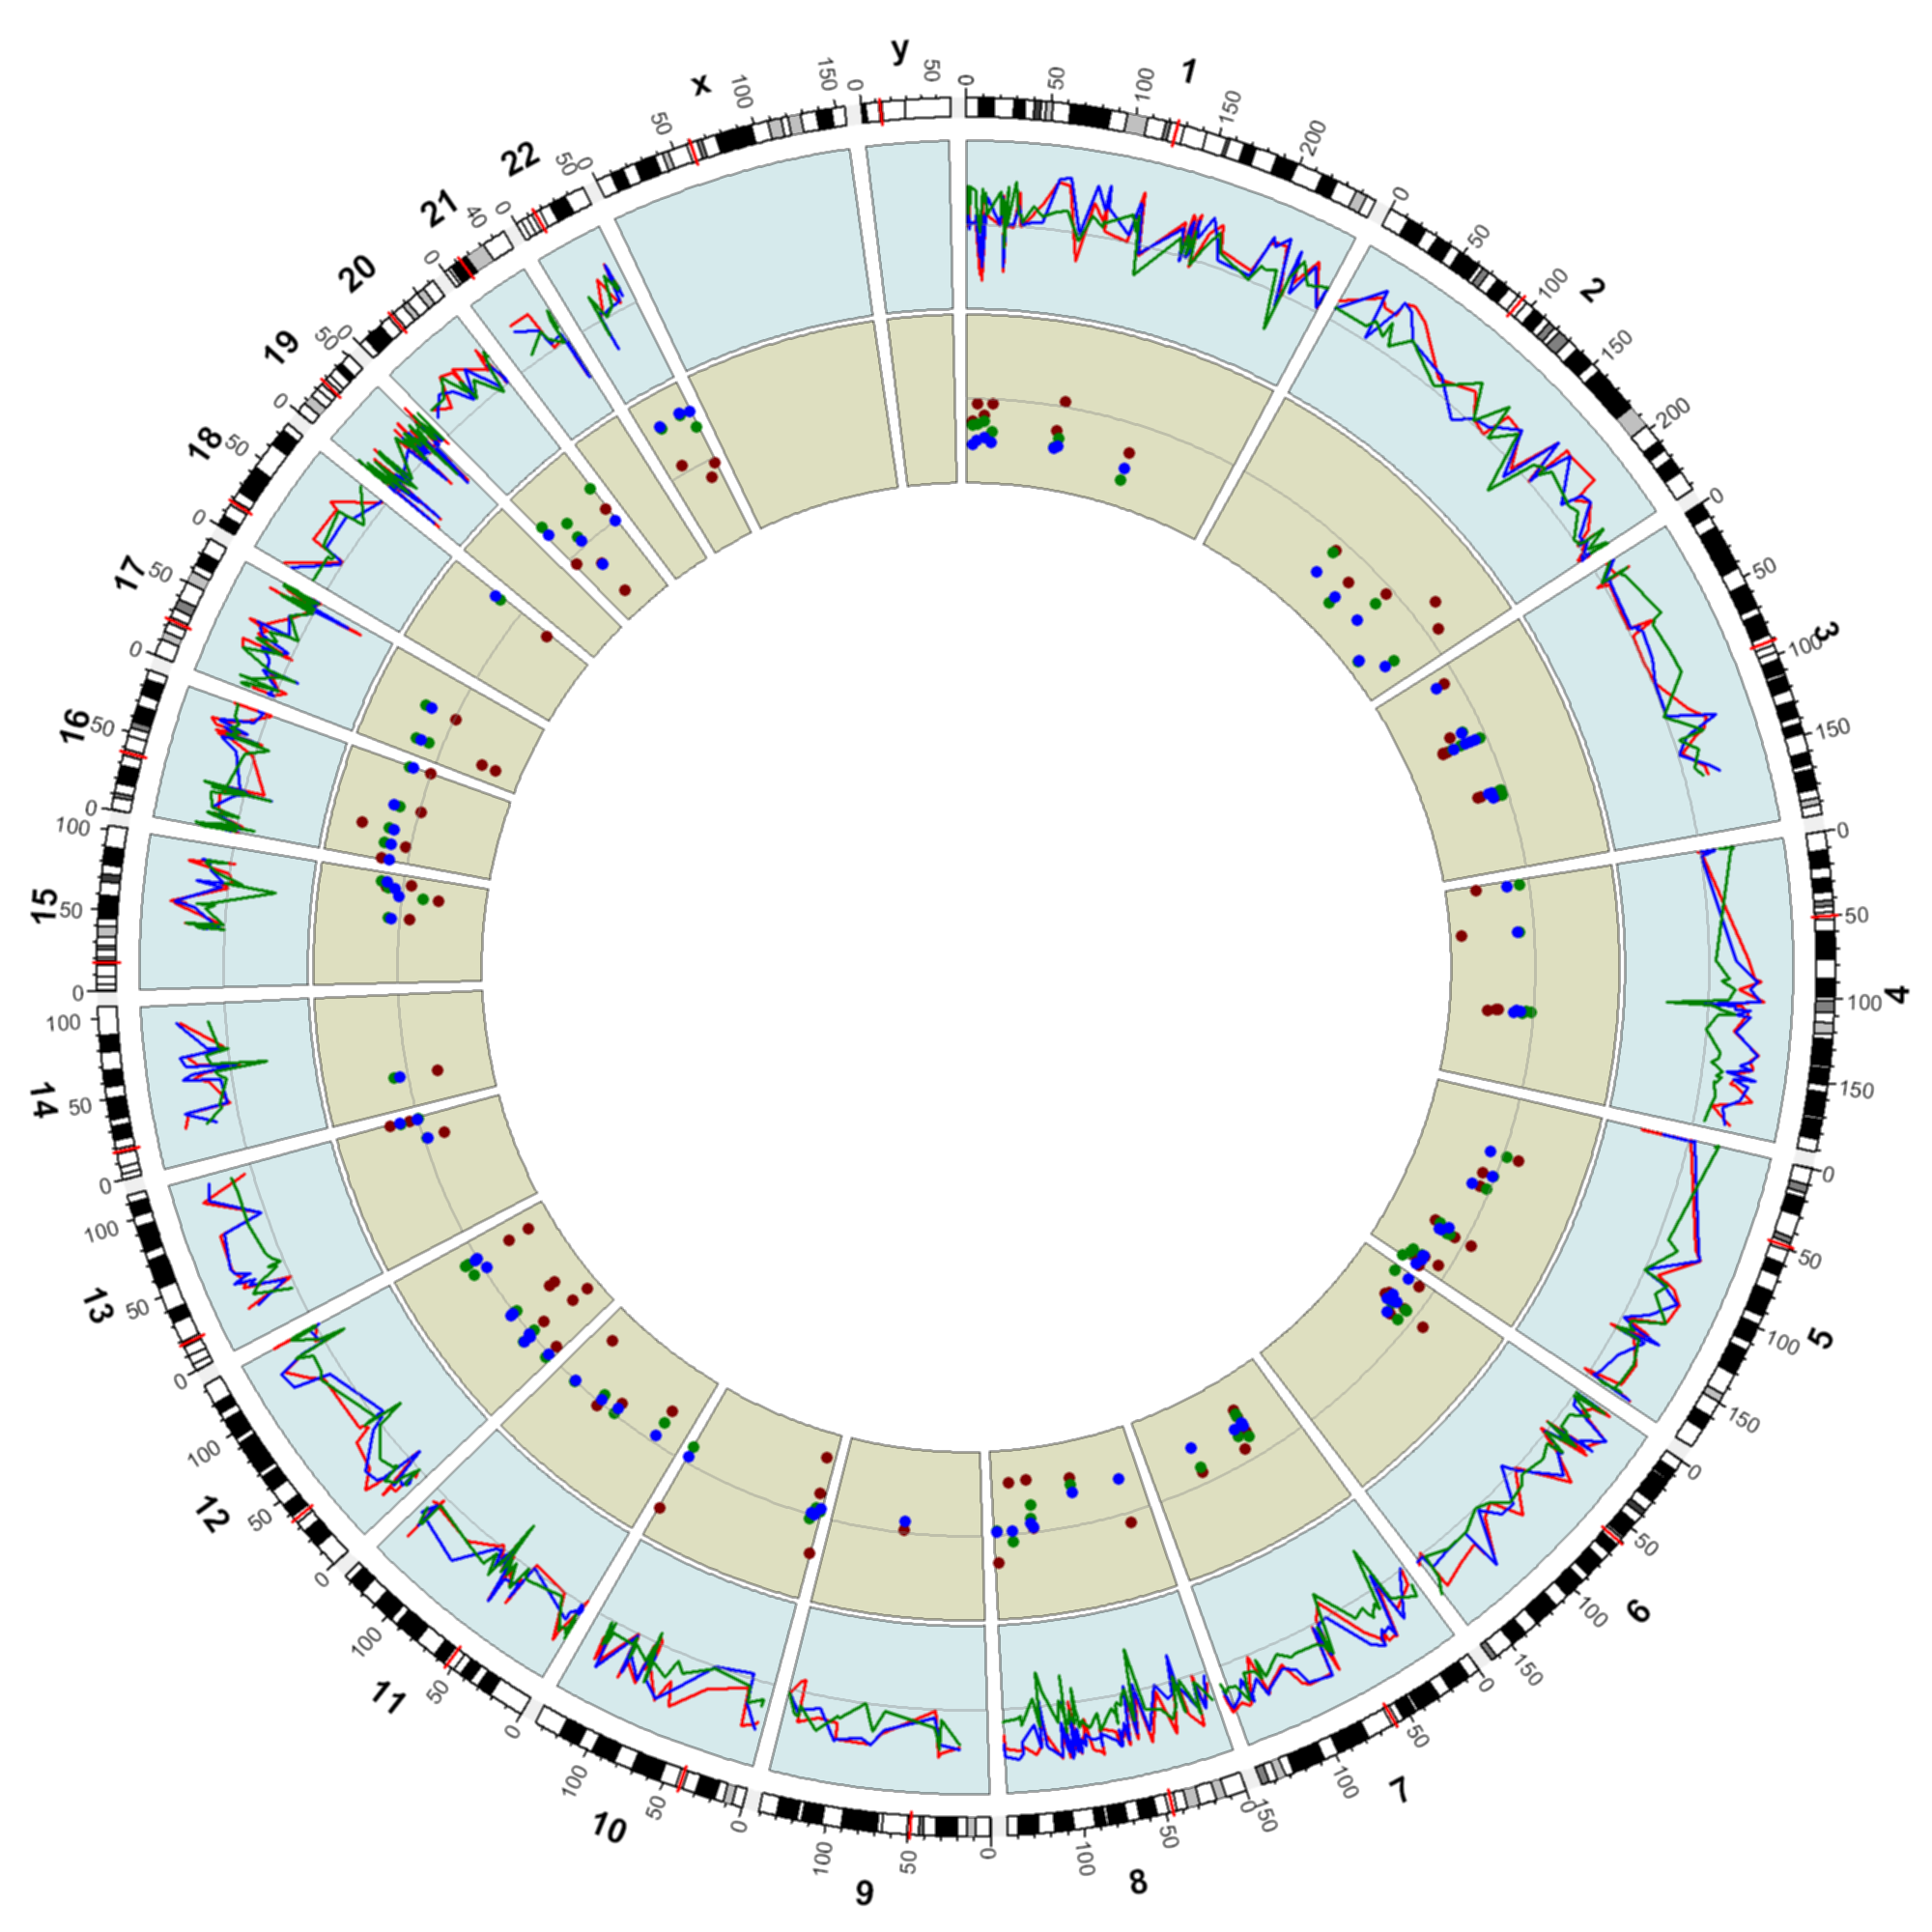
Chromosomal G-Banding pattern, Methylation and CNV data in three bands,
2000x2000 resolution:
Click for larger image.
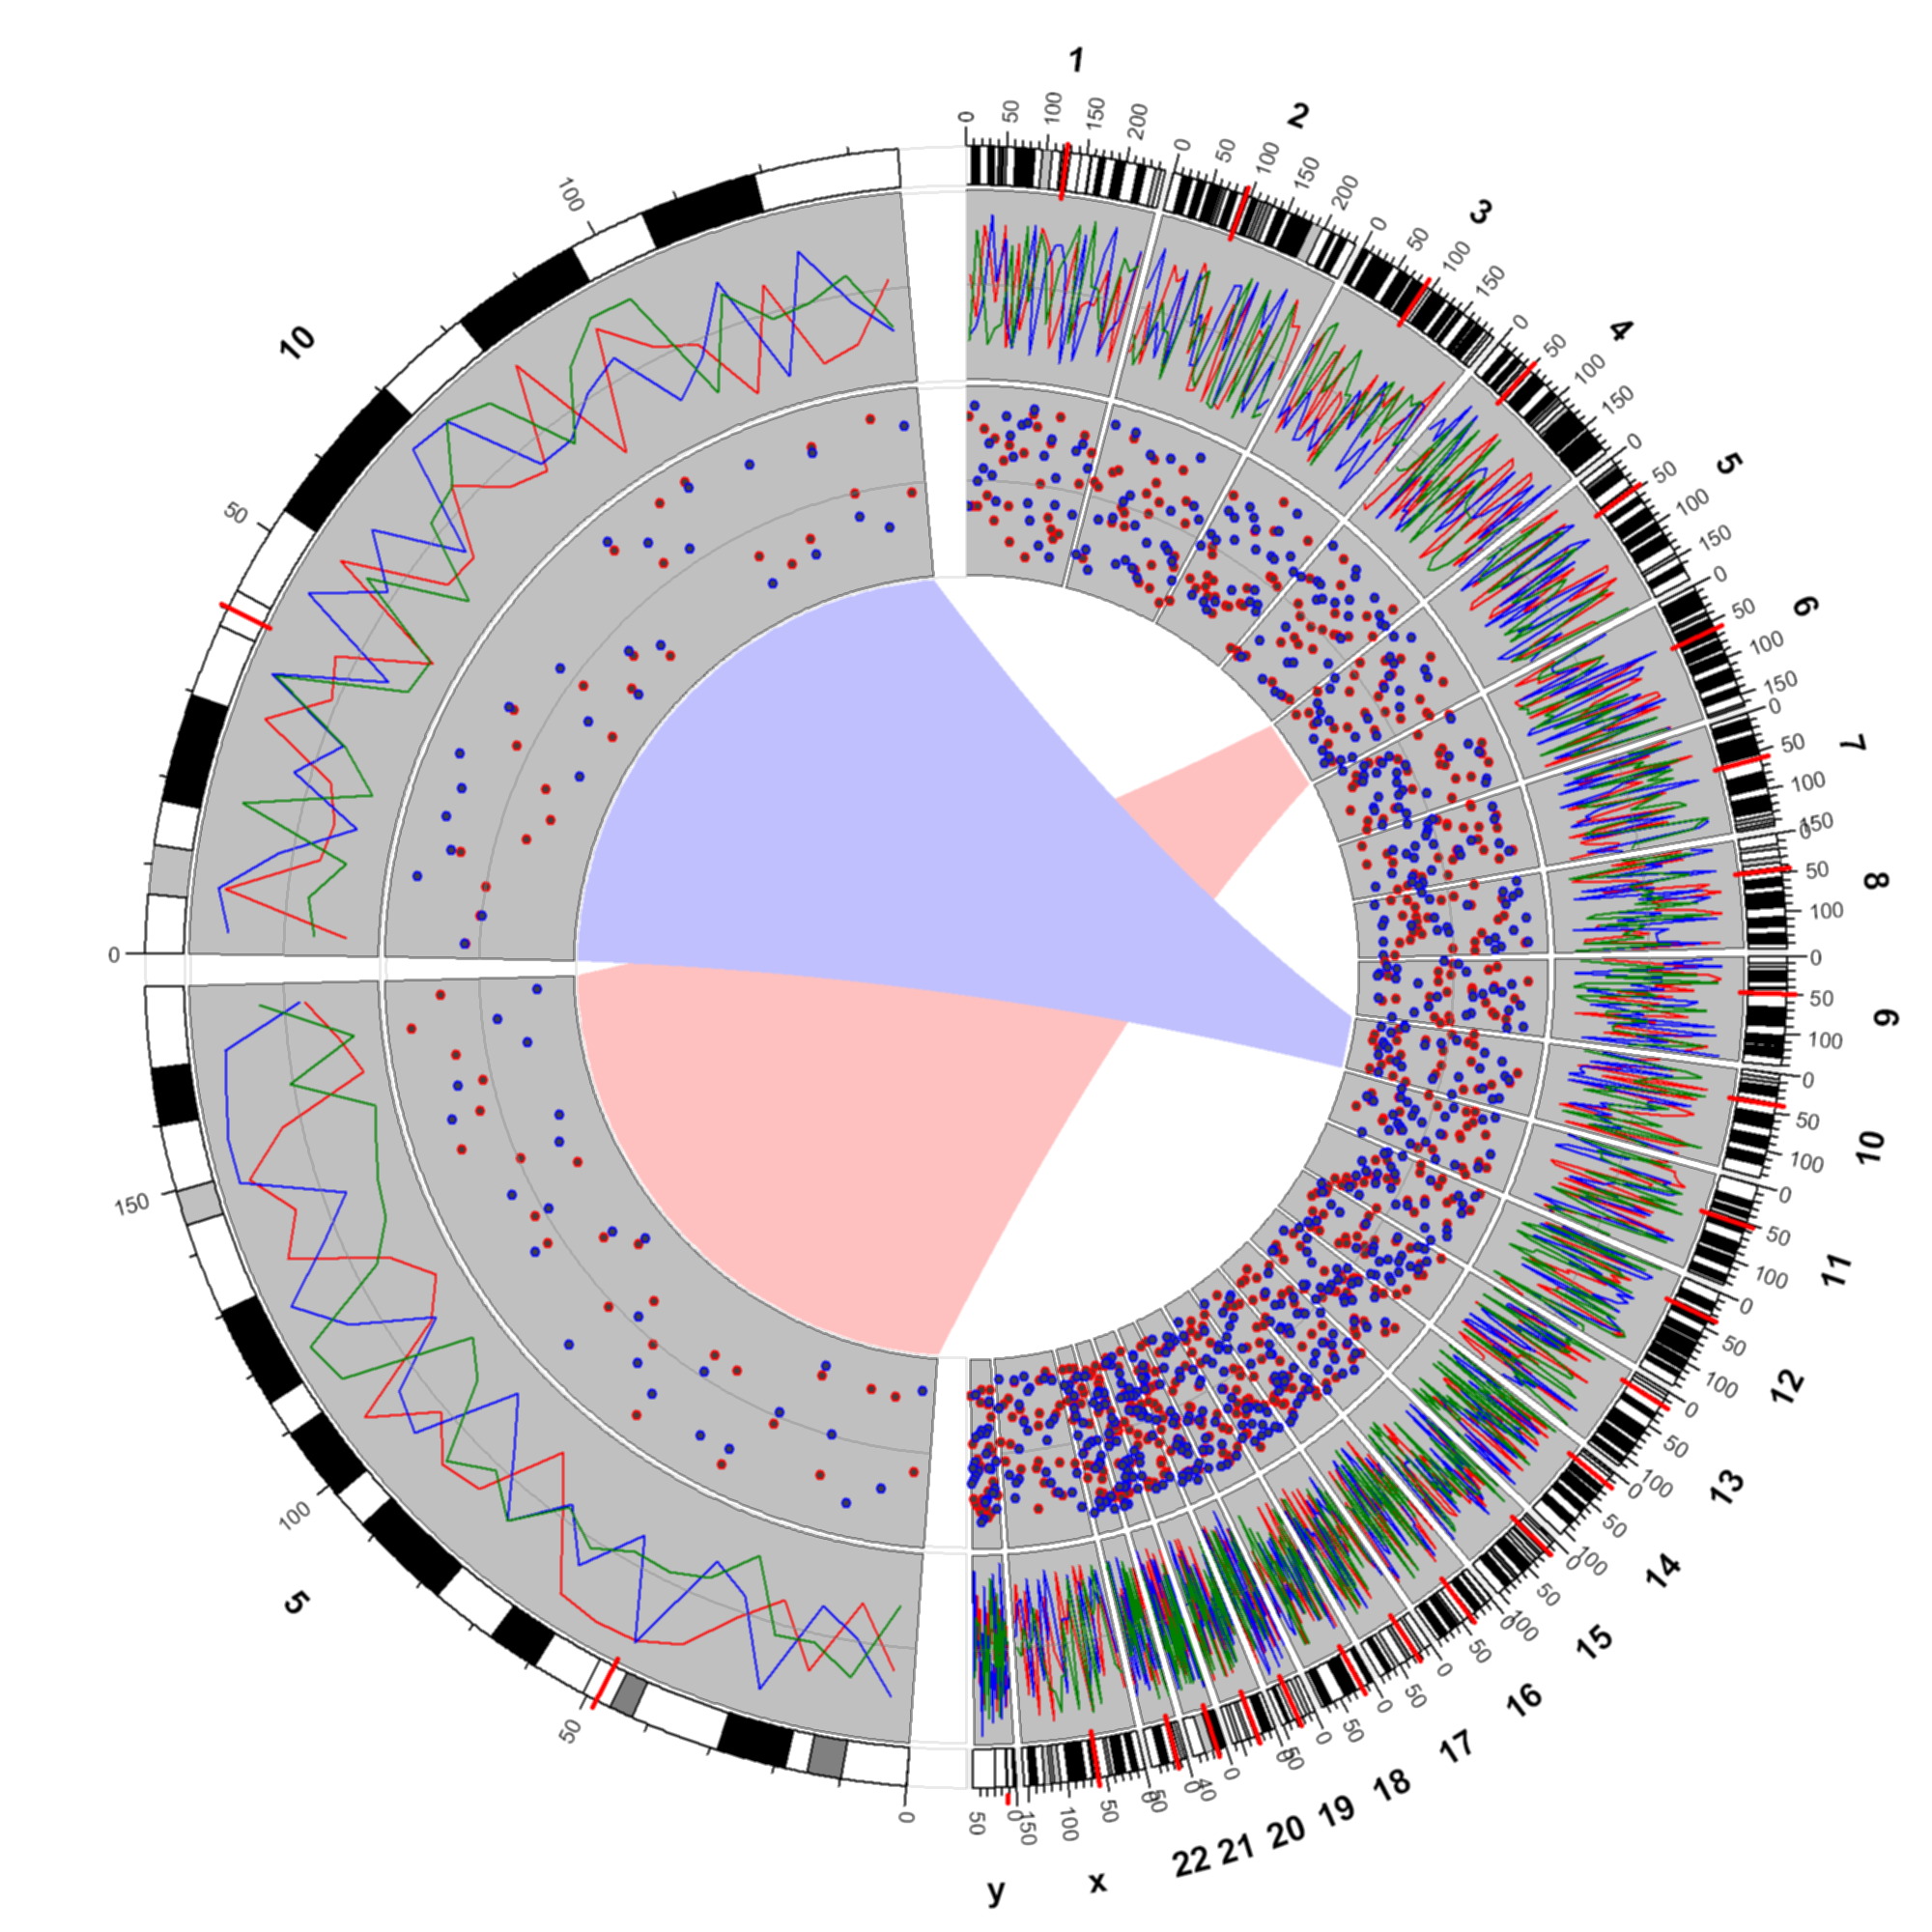
Left half: Chromosomal G-Banding pattern, random lines / dots in three bands,
Right half zoom bands 5 + 10
2000x2000 resolution:

Click for larger image.
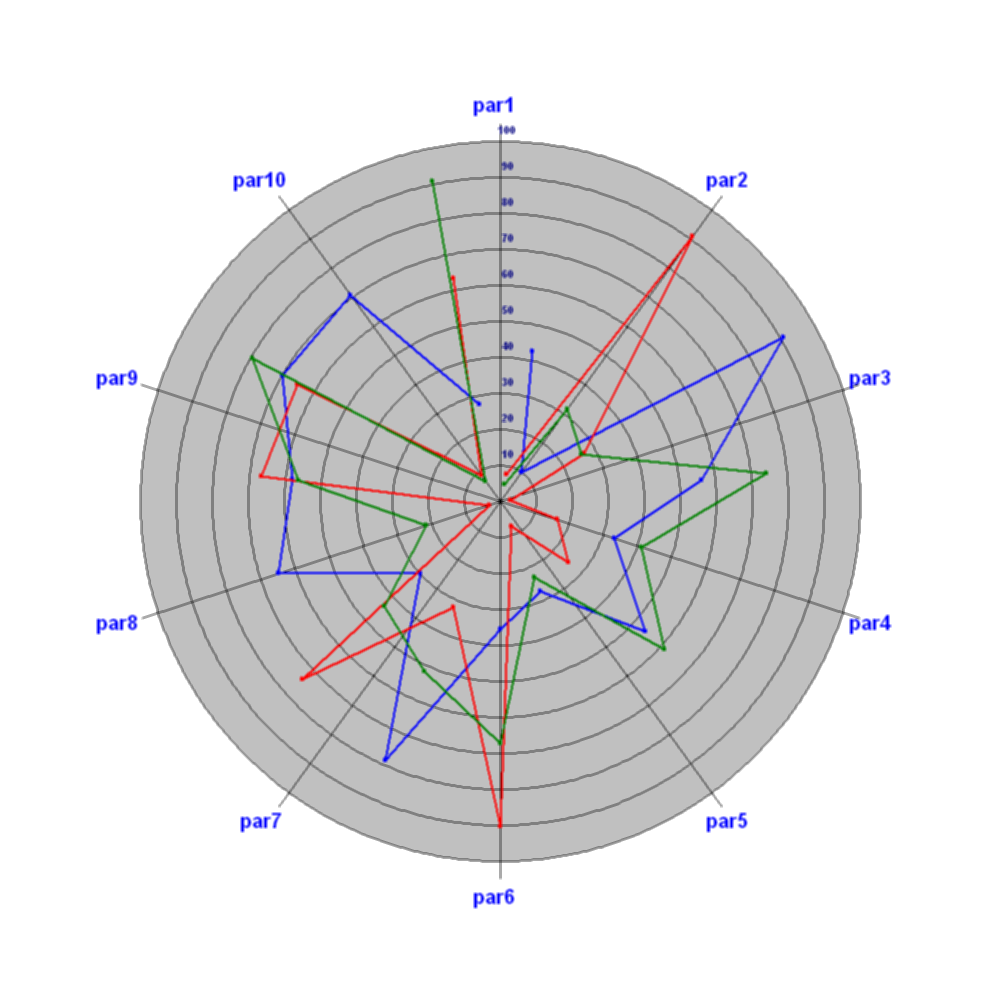
A basic "radar plot"
(with 3 random data series)
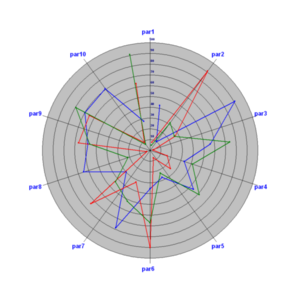
and the generating script.