| Command: | |
|---|---|
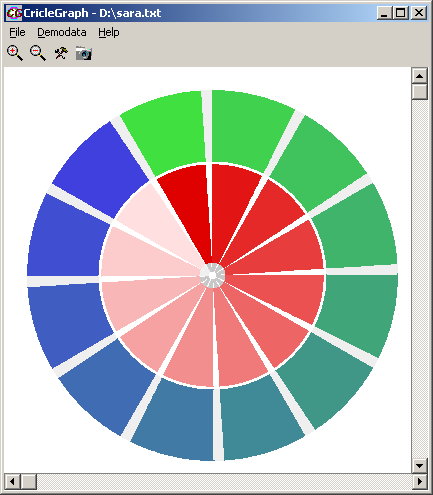
| segment=segment:xx | Define segment you want to modify To modify ALL bands, just define:segment=segment:all (doesn't apply to all commands |
| segment.color=gray | Set color for both, pen and brush. |
| segment.pen.color=gray | Set color for pen. |
| segment.pen.width=gray | Set pen width. |
| segment.brush.color=gray | Set color for brush. |
| segment.arc=xxx,yyy | Set position of the segment within the band. E.g. your band has a dimension from 0..3GBases (i.e. length of human genome in base pairs. Define a sement, representing chromosome 2: segment=segment:2 segment.arc=249250622,492449995 |
| segmentradius=xxx,yyy | Change freely position and width of the segment in radial direction. Coordinates are given in percent of the realtive to the containing band. BUT: be careful, you may overlay segments - erraneously. Or on purpose ? |
| segment.angledatarange=ssss,eeee segment.xdatarange=ssss,eeee | Redefine the datarange of the segment in angular (x-)dimension, which will be used for later placement of features. E.g . you want to place bars representing expression of 10 genes on chromosome 2 segment from above. It may be convenient to redefine segment two's data range to e.g. "1..1000" and place bars at 5..95,105..195,..,905..995 (or better use a bar series feature) |
| segment.radiusdatarange=ssss,eeee segment.ydatarange=ssss,eeee | Redefine the datarange of the segment in radial (y-) dimension, which will be used for later placement of features. E.g . you want to place bars representing expression of 10 genes on chromosome 2 segment from above. It may be convenient to redefine segment two's y-data range to e.g. -5 to +5. |
| segment.copysegments=sb,ss,tb,ts | Copy a segment. Define: - SB = ID of source band - ss = ID of source segment - TB = ID of target band. - TS = ID of target segment This will copy all parameters as well as all features contained n the source segments. E.g. you have a overview of features on a all chromosomes in the right half of a graph. Now you want zoomed view of a (view) segment in the left halt. Generate emty segments. Just copy the already prepared segments from the overview into the detail view segments. |
| segment.lefttranslate | Adjust the selected datarage so, taht left bordr==1. In the above Chromosome 2 example, transform segment 2's xdatarange to "1,243199373". NOw, it may be straightforward to place features with chromosomal coordinates. |
