With the entered dose and corresponding raw plating efficacy values the two models are fitted.
Beneath the parameters α /
α,β respectively also the Surviving Fravtion for Dose=0 (=y0)
according to the fit is computed.
Ths computed value is used to normalize the raw Plating Efficiacy
(Mean/Seed).
As result the SF for dose = 0 will be very close to 1.
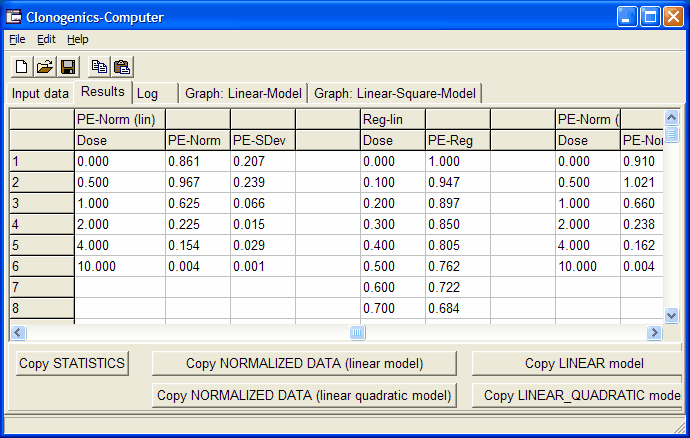
To view the normalized SF values, scroll the data table in the Results tab to the left:

The first SF-NORM (lin) data block shows the normalized Surviving Fraction (SF) values using the Dose=0 SF from the Linear model.
| Dose | The dose, as entered in the Input data tab |
| SF-Norm | The Surviving Fraction normalized with the Dose=0 value as computed from the linear model |
| SF-SDev | Computed error, taking the SDev% error from the input data (SF_SDev=SF_Norm*SDev%) |
Click the
Copy NORMALIZED DATA (linear model) button
to copy this data block into clipboard. This allows to paste the data into any graphing program with the aim to generate any kind of highly cusomized data graph.
Next, the Reg-lin
block gives the regression curve.
CS-Cal takes lowest and highest dose and creates a regression
line with 100 intervals.
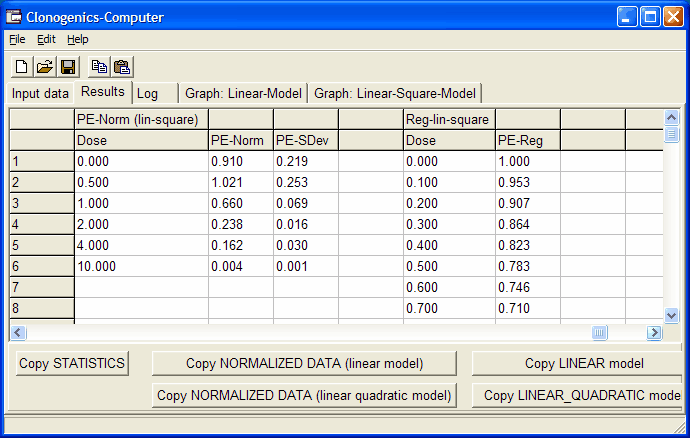
Analogous, data for the Linear-quadratic fit are show:

Click the corresponding buttons to copy repsective data blocks into other graphing programs.