CS-Cal - SF-Graph
With the entered Doses and corresponding Seed numbers and colonie counts the requested models are fitted.
Basic graphs are displayed in the SF-Graph tab
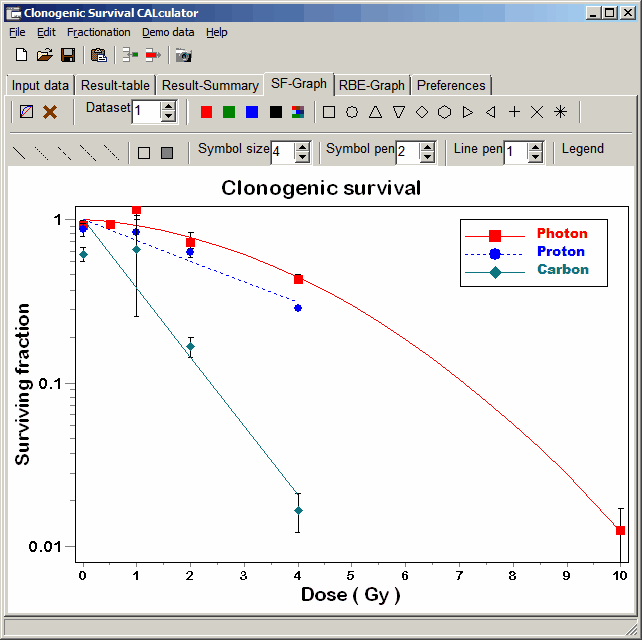
Customize a series' graph: Select a Dataset.
Either click the series in the graph with left mouse button (line or data points), or select the series
with the Dataset spin edit.
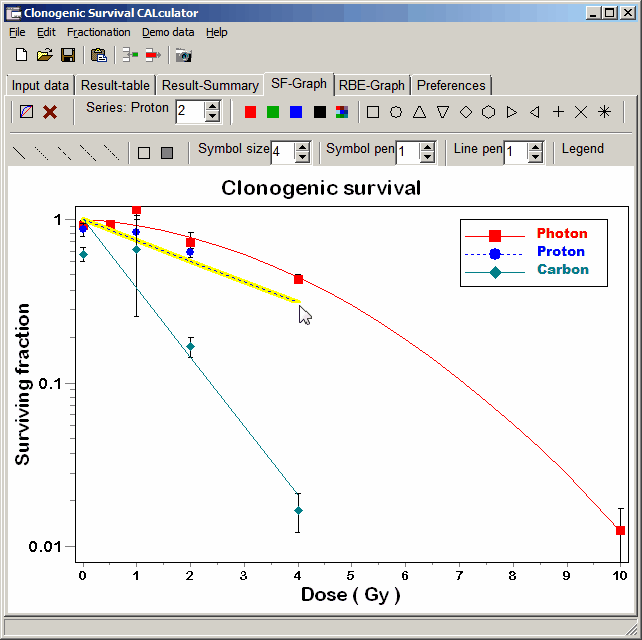 Now you may modify the selected data set's style by clicking any of the formating buttons
- color
- symbol
- symbol size
- filled/empty smbols
- symbol pensize
- line style
- line pensize
Right click into x/y-axis, series legend, title:
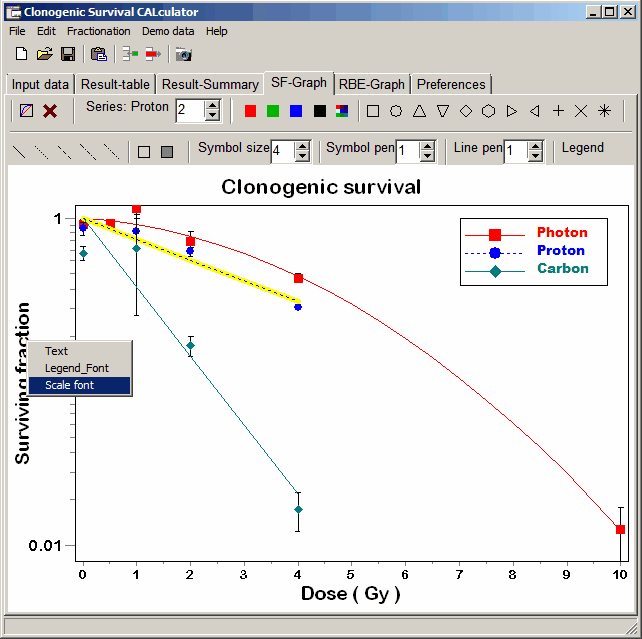 From the context menu set
- Text
- Font (face, color, style
- Frame
for each legend/title
- x-axes
- y-axes
- graph tigtle
- series legend
Click Series legend with left mouse butoon and move it (left mouse pressed) to a position
you prefer.
Select the data set (see above).
Right mouseclick into the graph.
 From context menu select:
- Add DOSE marker for selected series
- Add SF marker for selected series
From the fitted model, corresponding SF/Dose are computed, and marker lines are added to the graph.
- Remove all DOSE
Go to the Preferences tab to modify general graph settings (grids, scaling range, ...),
additional graph features.
Snapshot
 Click the "Camera" button to take a snapshot from the graph and place it into
clipboard (without Menu, Tabsheets, Tool- or Statusbars, ...),
Shift+Click Camera button = save graph as bitmap image.
Select filtetype:
- BMP - uncompressed image
- JPEG - compressed iamge
Ctrl+Click Camera button = save graph as WindowsMetaFile (*.wmf).
WMF is a vector format, allowing to change the size of the graph without qulity losses (e.g. in MicroSoft PowerPoint, OpenOffice Impress or InkScape).
You may even select individual components of the graph, reposition them, change propertites like color, font, ...
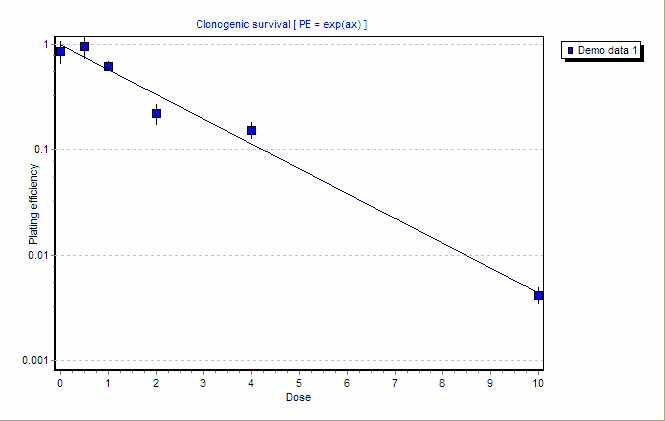
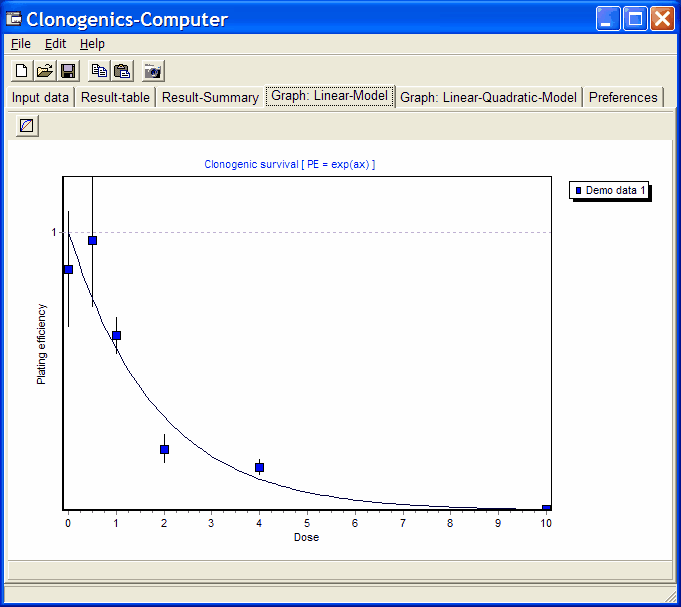
 Click this button to switch between
Linear / Log scaling of Y-axes:
Linear scaling:
Log scaling:
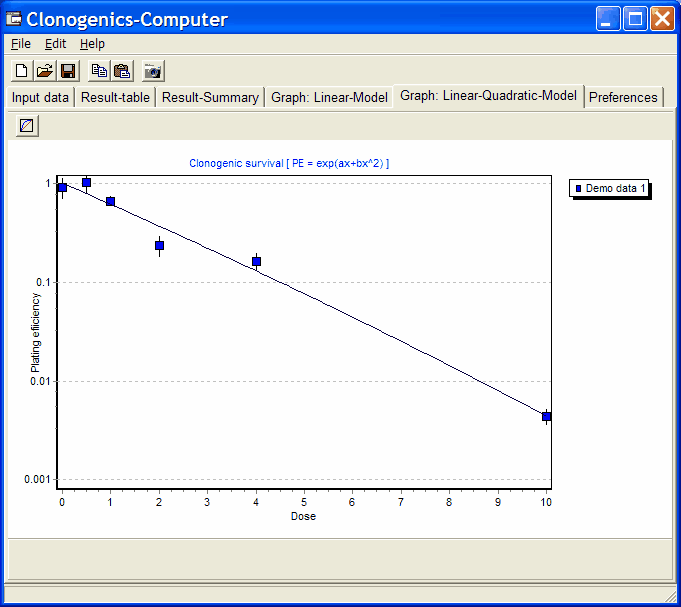
Default is log scaling.


 Now you may modify the selected data set's style by clicking any of the formating buttons
 From the context menu set
 From context menu select:
![]() Click the "Camera" button to take a snapshot from the graph and place it into
clipboard (without Menu, Tabsheets, Tool- or Statusbars, ...),
Click the "Camera" button to take a snapshot from the graph and place it into
clipboard (without Menu, Tabsheets, Tool- or Statusbars, ...),
![]() Click this button to switch between
Linear / Log scaling of Y-axes:
Click this button to switch between
Linear / Log scaling of Y-axes:
