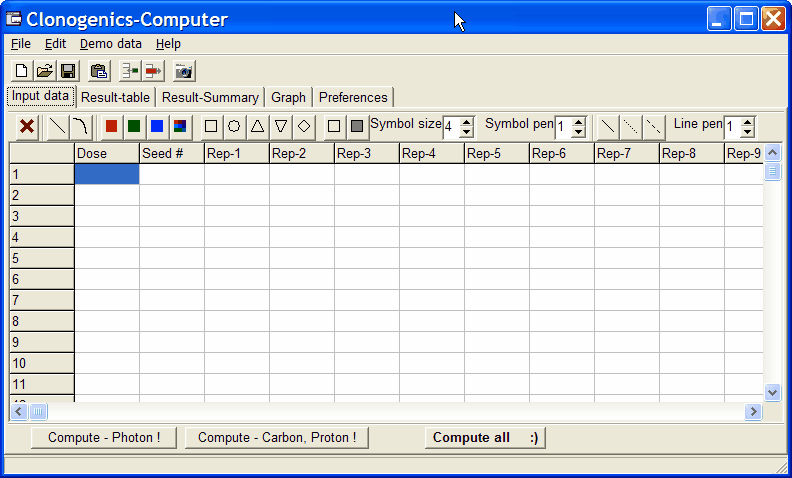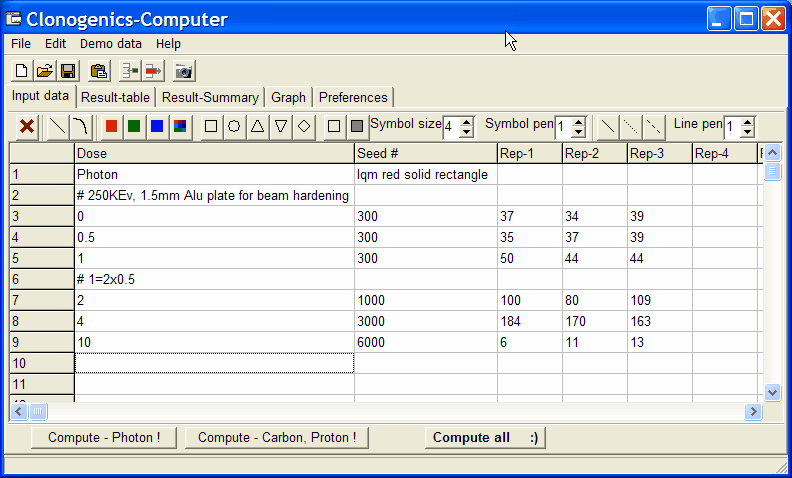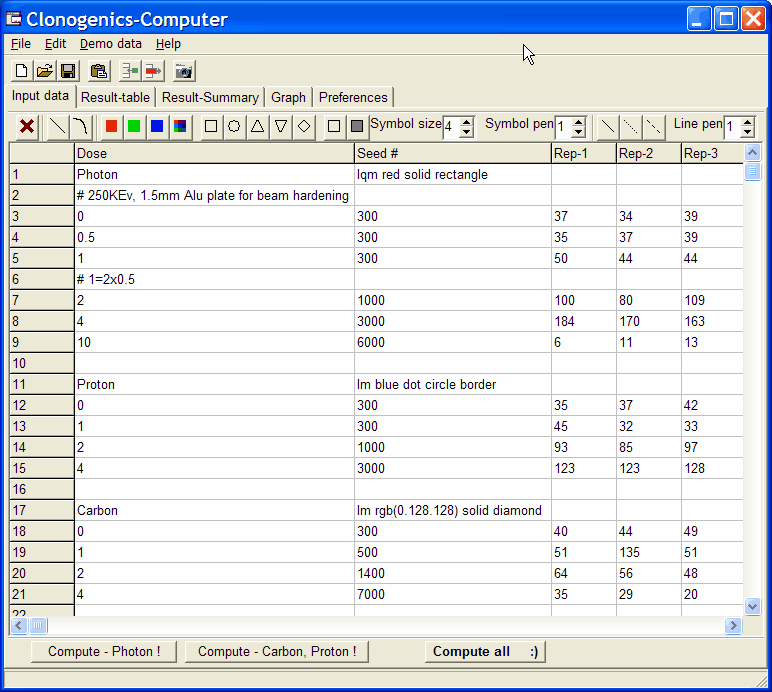
When you start CS-Cal the data entry page is displayed:

Enter your data:
In first row, first column you may enter a Name for the dataset, which is also used lateron in the graphs.
In first row, second column you may add graph formating information and type of analysis (linear / liner-quadratic model). Click this cell and use the tool bar buttons to set the available parameters:In the following lines, enter your
| Dose | In this column you should enter the dose by which the cells were treated. e.g. radioactive dose in Gray, or concentration of chemicals, ... (if this field is empty the whole line will be skipped) |
| Seed # | The number of cells seeded into the culture plates / flasks for the respective dose Obviously, this number must be larger zero, otherwise computations will generate errors. |
| Rep-1... | Number of counted colonies for the respective dose. As many replicated counts in the
corresponding columns. Colony counts should be larger zero !! |
| sf-graph.title.text=anytext | define the title text for the SF-graph |
!! NB:
CS-Cal tries to convert the entered values into numbers. ANY
value which can not be converted into a number will be used as 0
!!
CS-Cal tries to convert German decimal-comma into international
decimal-point (0,123 => 0.123) automatically.
Instead of entering data you may also paste data: Click the target cell and select When done with data entering, you may save the data set as tab-delimited text file with A previously saved data-set may be loaded with As soon as all data are entered click the respective COMPUTE button to perform the analysis: CS-Cal checks: Is the first row / first column a text => use it as name for the analysis. If not a
Dialog requests to enter a name for the analysis. All followng lines are used as clonogenic data, until a line is found where the Dose field is
empty. In case you have multiple datasets you want to analyze and display the results in the same
graph, you may place data multiple sets divided by one (or multiple) empty lines into the Input data
tab-sheet: For each analyses, result
data are displayed in Result-Table and Result Summary
tab sheets. To reuse these data in other applications, copy them
out of these tab-sheets. If you want to view the
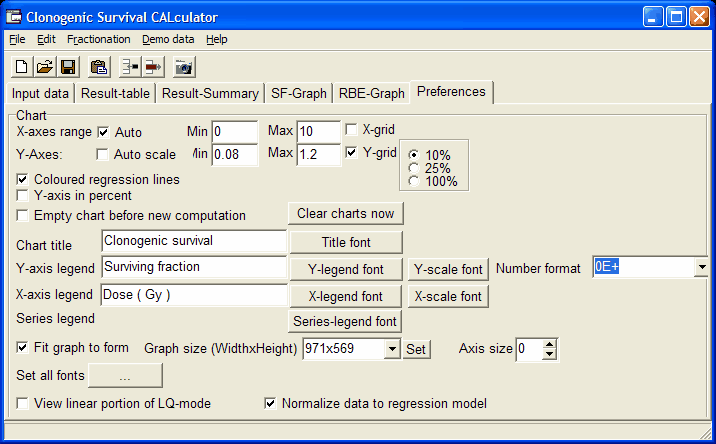
graphs from all analyses together, go to the Preferences
tab-sheet and un-check the Empty chart before new
computation check-box:
Main menu | Edit | Paste or click the corresponding tool-bar button.
Man menu | File | Save as or click the respective tool-bar button.
Main menu | File | Open or click the respective tool-bar button.
Results are displayed in the other data tabs.

Now click into a datset, then click the Compute - PHOTON / Compute - Carbon, Proton
button to compute a single dataset.
In case you have defined the analysis type for each dataset, simply dpouble-click into a dataset.
Alternatively click the Compute - ALL button to evaluate all entered
datasets with the defined linear/linear-quadratic models.
