CS-Cal: Preferences
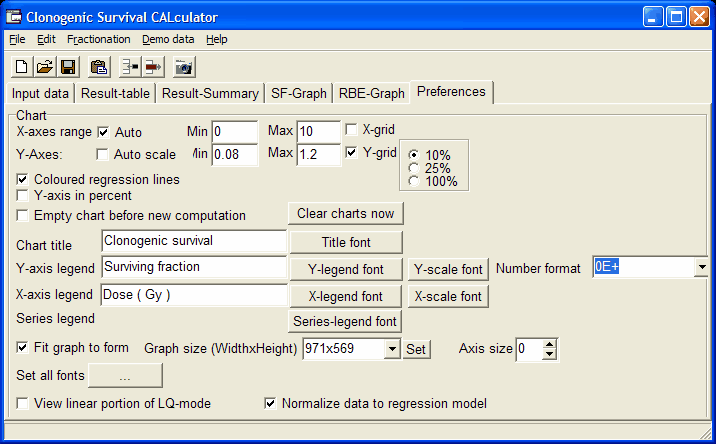
On the Preferences tab you find several options to customize the graph:

X-Axes:
Check the Auto field to autoscale the x-axis (Dose)
Uncheck to apply user defined Min and Max values.
Check the X-grid field to view vertical grid lines.
Y-Axes:
Check the Auto field to autoscale the y-axis (Surviving fraction)
Uncheck to apply user defined Min and Max values.
Check the Y-grid field to view horizontal grid lines.
Select 10% or 50% to change y-grid resolution
Define text for Chart title, Y-axis legend and X-axis legend.
Define font family, size, style and color for Chart title, Y-axis legend, X-axis legend and series legend independently.
Define widht of axis Axis asize
To generate always the same sized graph, define the graph dimension in the Graph size (widht x Height) field and click the Set button.
Uncheck Fit graph to form. Now the graph will always have the predefined size, captured images also will have the same size, independent of actual window size.
Check View linear portion of LQ-model to display extrapolation number n, quasi threshold dose Dq and mean lethal dose D0
for Linear-Quadratic model fitted datasets.
Check Normalize data to regression model. Data will be normalized to PE at dose=0 Gy using the value computed from the regression model.
If unchecked, data will be normalized to measured PE.
