Scatterplot - Data files / entry
Additionaly to the x-/y-values you may visualize 4 additonal values for each datapoint:
- Symbol size:
The size for the symbol of each indivual data paint may be adjusted to a third numerical value.
Symbol size is auto scaled from one (a single screen pixel) to a mixmum (userdefineable, default amx=50 pixel).
- Color:
The brush color for the symbol of each indivual data paint is adjusted to a fouthird numerical value.
Color is auto scaled to a user defineable palette.
- X-error, shown as a horizontal error-bar
- Y-error, shown as a vertical error-bar
Alternatively you may define groups and customize symbols for these groups (see below).
Datafiles
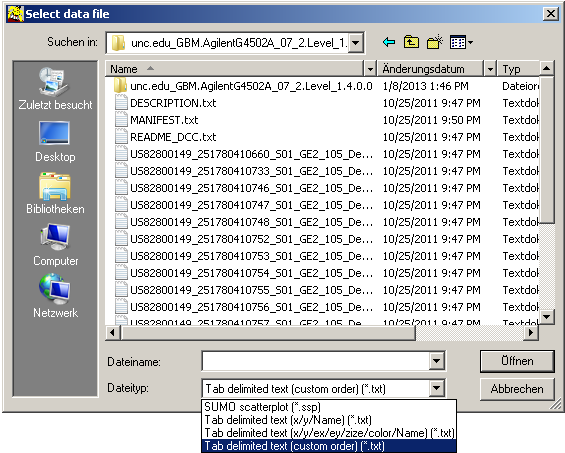
SUMO supports a custom format as well as tab delimited text file.
Tab delimited text files:
Simple ASCII text files:
- One datapoint per line
- x-/y-/annotation data fields divided by TABs or
- x-/y-/x-error-/y-error-/size-/color-/annotation data fields divided by TABs or
- custom defineable data columns
Select the data file, next a column selection dialog opens up:
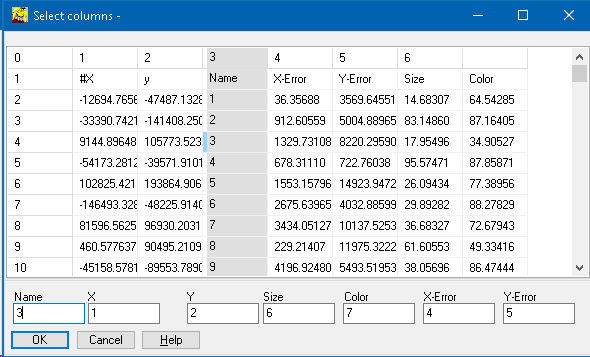
Click into a column, next into the respective column textfield,
(in the exmple Click column 3 in the table preview, next text field "Name")
or type the column ID into the fields.
Empty non required fields.
All data may be supplied as floating point values.
Non numeric values in data fields as well as mising data vlaues are converted to ZERO.
Superficial data are ignored.
SUMO tries to acommodate both german as well as english decimal divider.
Size value - used to scale the individual data point's symbol size - should be supplied as positive values.
Internally it is always converted to positive numbers.
Name for a data point should not contain internal TABs.
Data lines with both invalid x- and y-value are skipped.
When opening a datafile select the required data format from the format list:
Custom SUMO scatterplot format
A xml like format, containg data as well as formating/viewing information (e.g. selection groups).
Drag and drop data files
Drag a suited data file from Windows' explorer into Scatterplot Viewer.
SUMO tries to recognize the data format and uses the most similar
pattern to parse the data.
Superficial data are ignored.
Copy paste data
Paste data from Windows clipboard into Scatterplot viewer.
Similar restrictions for data as with data file loading apply.
Select Main menu | Edit | Paste data.
Paste multi-column data:
- x/y/Name
- x/y/Error-x/Name
- x/y/Error-y/Name
- x/y/Error-y/Erro-x/Name
Paste single data columns independently:
- x-data
- y-data
- x-error
- y-error
- Symbol ("bubble") size
- Color
- Name
All data columns MUST have exactly the same number of entries - obviously.
X- and Y- MUST be pasted. All other are optional.
Paste X-data first.
Additional data rows - exceeding the length of X-data - are ignored,
missing data vlaues are set to ZERO.