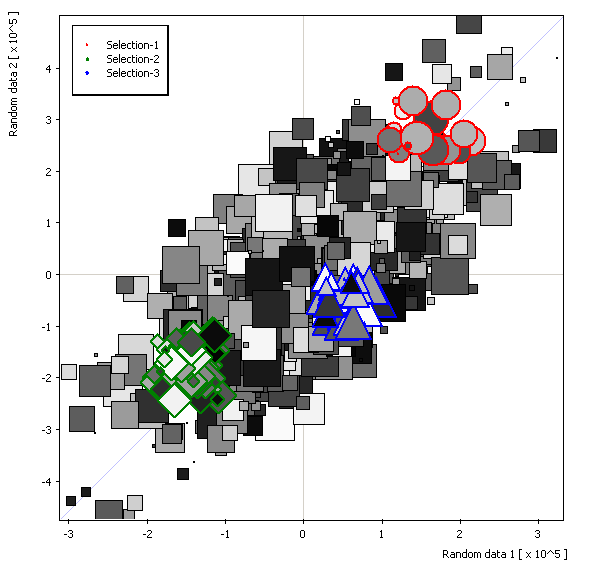
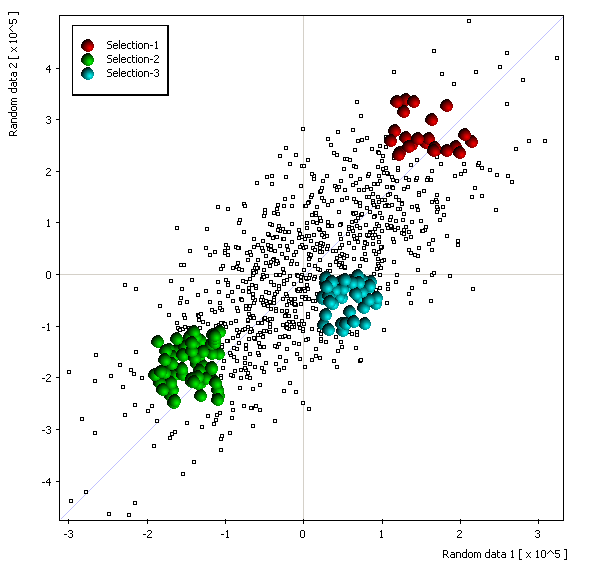
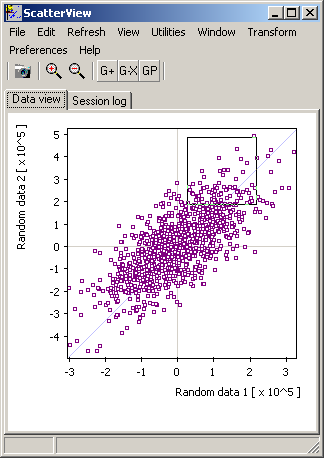
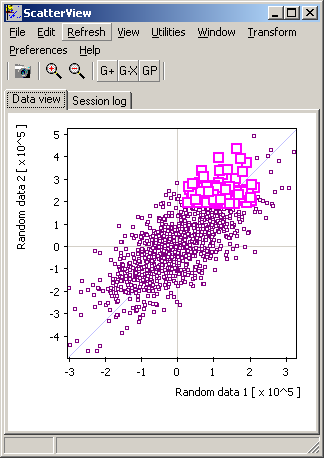
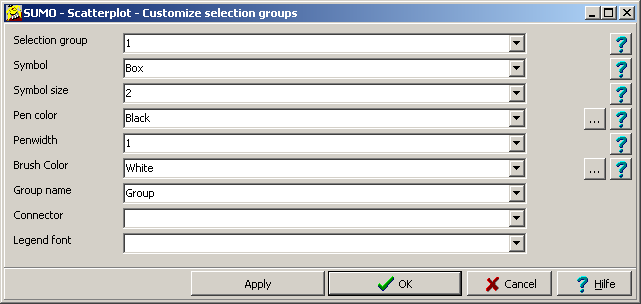
Scatterplot - Selection groups

To emhpasize certain sub-groups in your data set, you may visualize sub-groups defining specific:

Select data points for a group:
Sub-group preferences are memorized.
Different sets may be saved for later reusal.


Select data points


Draw a selection area with left mouse button pressed on the scatterplot.

Select the ROI type first (Main menu | Preferences | Selection):
All datapoints within the selected Region Of Interest (ROI) are listed in the Seesion log tabsheet.
Select Main menu | View | Selection list to view an additional table showing the selected datapoints' values:


Find datapoints


Select Main menu | Edit | Find

Either seach on

A list of matching data points is shown in the Session log tab-sheet.


Define groups


Click the  G+   toolbar button to define the selected data points as a group.


To remove all groups, click the   G-X   toolbar button.

Join any two selection groups: Main menu | Preferences | Selection | Join selection groups.


Customize the group's preferences


Click the   GP   toolbar button.

A parameter dialog opens up:


To select a group for customizing, just click one member datapoint in the scatterplot or Select group edit/drop-down field in the dialog.

Adjust the values accordingly:

Selection groupSelect the selection group you wish to change,
or more easily just click with left mouse button into the group in scatterplot view.
The group's parameters are shown in the dialog.
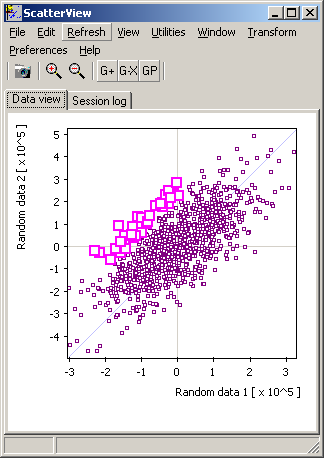
SymbolSelect a symbol from the drop-down list:
Box,circle,triangle,diamond, ... female-/male-symbol - obvious
3D-Sphere: Plot a sphere with color gradient, bright spot "looking" into a certain direction:
define: 3D-sphere;backgroundcolor;centrecolor;xdirection;ydirection
Color: any color (red,green,blue,...,rgb(rrr,ggg,bbb))
To pick any color use SUMO's color picker: SUMO | Main menu | Utilities | Color picker.
Select a color and click the   >C  -button to copy the color value into clipboard.
Direction: 0..100, with 0=left/top, 100=right/bottom
e.g. "3d-sphere;navy;red;66;66; =>  
e.g. "3d-sphere;rgb(192,255,192);red;33;66; =>  
Select "none" to hide the group.
Symbol sizeSize of the symbol in pixel
Select "none" to keep the dataponts' size in case the "size"-series was specified.
Pen colorSelect a color to for smybol's border.
Select any of the preset colors.
Define a custom color with "rgb(rrr,ggg,bbb)"
Click the   ...  -button to open a color selection dialog.
PenwidthWidth of the symbol's border in pixel.
Brush bolorColor to fill the symbol.
Same option as above for pen color
Select "clNone" to keeep the data points' color in case the "color"-series was specified.
Group nameName of the group, showing up in the group-legend panel.
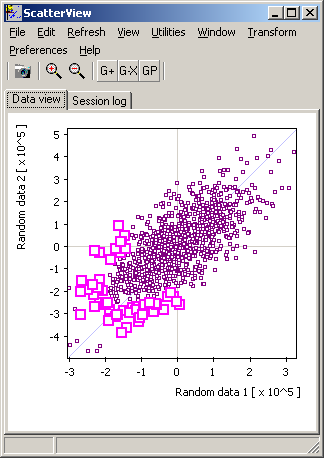
Connector.Connect all group members by lines to their centre of mass:
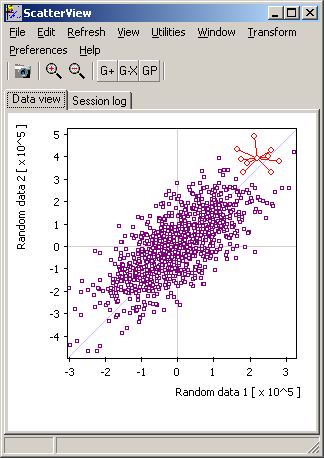

Present group settings are saved when closing Scatterplot viewer.

You may also save a specific set (e.g. project specific settings) separately:
Main Menu | Preferences | Selection | Save group settings.


Sample scatterplot:


Variable symbols's size/color were kept in the selection groups, by defining both size/color as "none" for all the selection groups.


Same data set as above, but: