Scatterplot viewer - Volcano plot
The Volcano plot is a special case of a 2D scatterplot.
Wikipedia explains:
In statistics, a volcano plot is a type of scatter-plot that is used to quickly identify changes in large data sets composed of replicate data.
It plots significance versus fold-change on the y and x axes, respectively.
...
A volcano plot is constructed by plotting the negative logarithm of the p value on the y axis (usually base 10).
This results in data points with low p values (highly significant) appearing toward the top of the plot.
The x axis is the logarithm of the fold change between the two conditions. The logarithm of the fold change is used so that changes in both directions appear equidistant from the center.
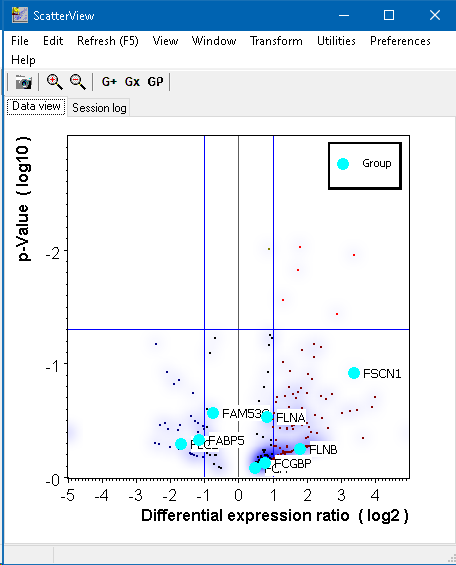
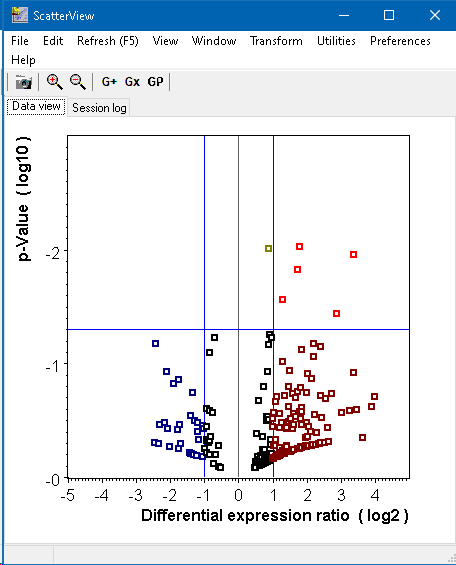
Plotting points in this way results in two regions of interest in the plot: those points that are found toward the top of the plot that are far to either the left- or right-hand sides. These represent values that display large magnitude fold changes (hence being left or right of center) as well as high statistical significance (hence being toward the top).
In SUMO Scatterplot viewer
Import data:
- open a tab separated text file
- paste a tab separated list from clipboard
Data should be organized:
- 1 data point per line
- tab separatered x/y values, optional name,x/y-error ,...
- x-value: ratio, either relational or log2
- y-value: p-value, eihter as direct p-value, lop10(p), -log10(p)
Transform data
Select
Scatterplot viewer | Main menu | Transform | Volcano
Select the respective soucer daa format (e.g."p/log2(ratio)"), to convert data (if required) and adopt the display.
Ratio thresolds are automatically set to -1 .. 1, p-thresjold to 0.05.
Click into the graph and move the mouse to adjust ratio-/p-valiue thresholda.
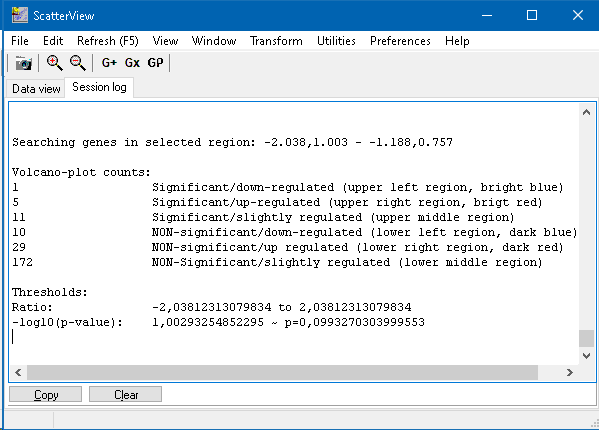
Counts for the different regions of the Volcano plot are shown in Session log tabsheet:
Obviously, you may use the various viewing options to customize the Volcano plot: