Assume you want to analyse multiple groups (e.g. G1=Liver <=> G2=Lung <=> G3=Kidney <=> G4=Pancreas) and find genes which might be differentially expressed in any of the groups.
Lets calculate Average(M1,M2,
... Mn) and Variance (V1, V2, ... Vn)
for each group.
The statistical 0-hypthesis is, that all groups are statistically comparable,
i.e. all Averages and Variances are the same ((M1=M2=...=
Mn, V1= V2=...=Vn). We now want to
find those genes for which this 0-hypothesis is not fulfilled.
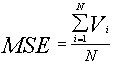
Therefore, we calculate the average from all variance (MSE=Mean Square Error):
MSE = Average from Group Variances
and Variance of group averages ( Mean Square error Between groups)
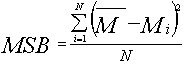 mit
mit 
The ratio of both
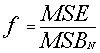
should be one if the 0-hypothesis is true.
The f-ratio can be converted into a p-value using the
f-distribution
(assuming Gaussian distributed data for all groups).
Genes with p-values
p ~ 1 full fill the 0-hypthesis
p << 1 are able to differentiate between the groups.
Click the ANOVA-button:
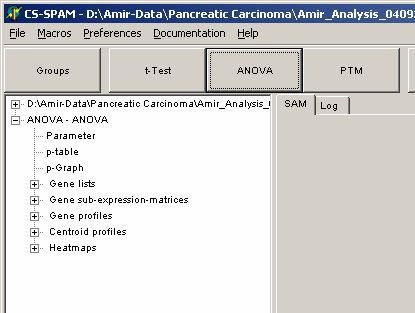
The parameter dialog-pops up
In the Groups
tab-sheet select all required hybridisations. Set the number to 3 or more:

On the Parameter
page select:

Select the algorithm how p-value is estimated:
f-distribution to derive p-values from f-distribution
Permutations and number of permutations to estimate the p-value using a permutation scheme (not implemented yet)
Click OK button, and run the analysis.
In the experiment tree a new entry shows up:

Click any of the listed items:
Set the critical p-value
alpha using the p-Graph:

The Graph shows the number of matching genes
(i.e. those with corresponding p-values) in dependence of the p-value (here
decadic logarithm).
Blue curves show p-value according to
f-distribution, green curves show p-values
according to permutations.
The table show numbers of genes with p-values equal or smaller the set critical p-value.
Use the slider to adjust alpha and watch the changing number of genes in the table.
Click the respective table field to use for subsequent data views. E.g. if you want to use the 713 genes which passed the Bonferroni corrected f-distribution test click the table cell Distribution / p-Bonf.
View the Parameter for this analysis
Analyse the different views of those genes which have p-values < alpha
Gene profiles
Centroid profiles
Heat maps
Save the matching genes
Gene lists: gene names and numerical T-Test values
Gene sub-expression matrices: Expression matrix including gene-expression values
last edited 24.09.2006,