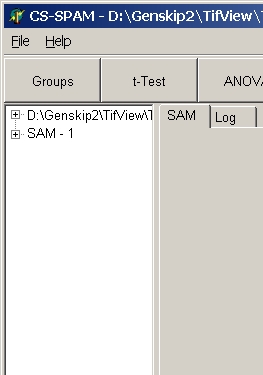
All processing results are listed in the analysis tree:
Click a tree node to view it's contents:
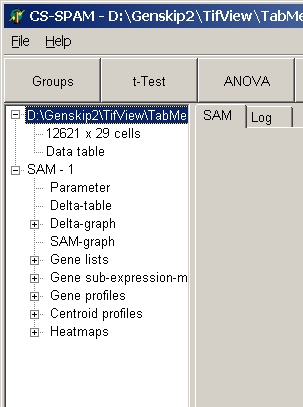
Depending on the analysis, different sub nodes show up.
Click a sub node to view its contents.
For details about the objects see the respective analysis' description.
In general, there are 4 basic data objects:
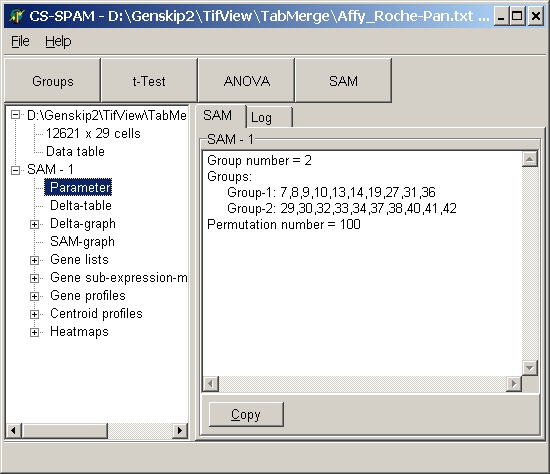
Simple multi-line text info.
Mostly used for listing of processing parameters or general result summaries.
E.g. SAM Parameters:
Here, large amounts of data are shown in a spreadsheet.
Used to display for example lists of statistically significant genes, statistical data tables, ....
E.g.: SAM Delta table:
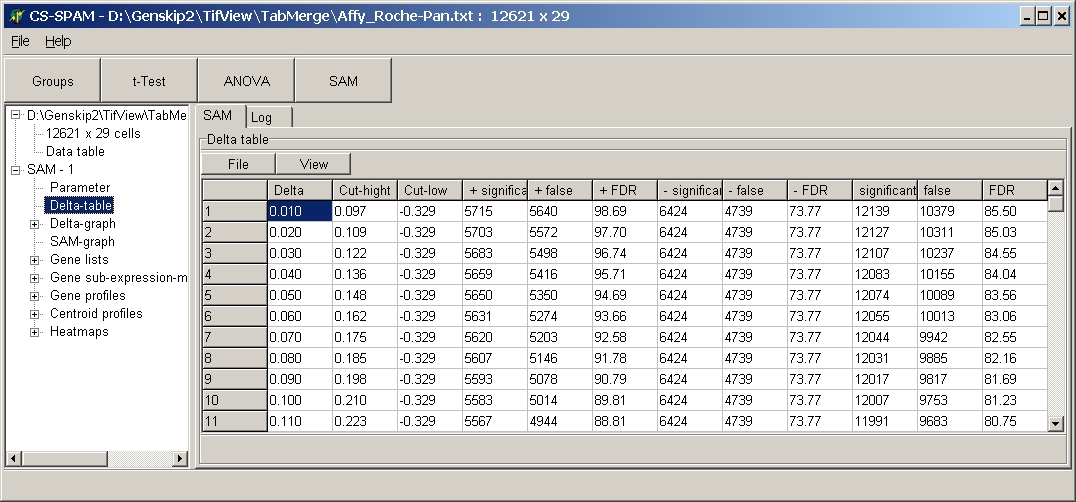
To save a table click the File button and sleet Save:
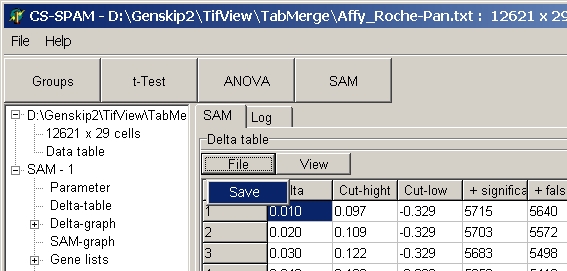
The table is saved as tab delimited text file.
To change the font click View button and select font:
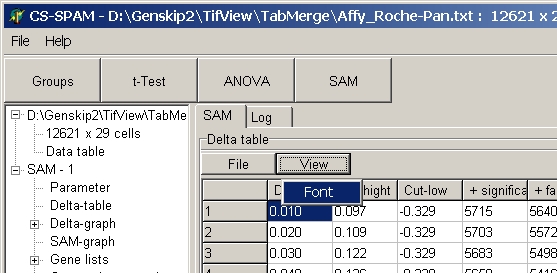
From the font select another font / font size.
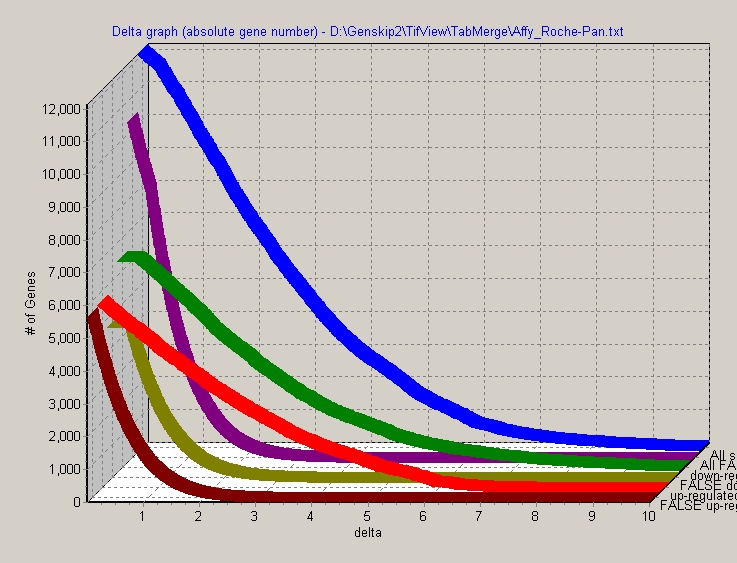
Used to view large data tables in graphical form.
For example SAM Delta-graph:
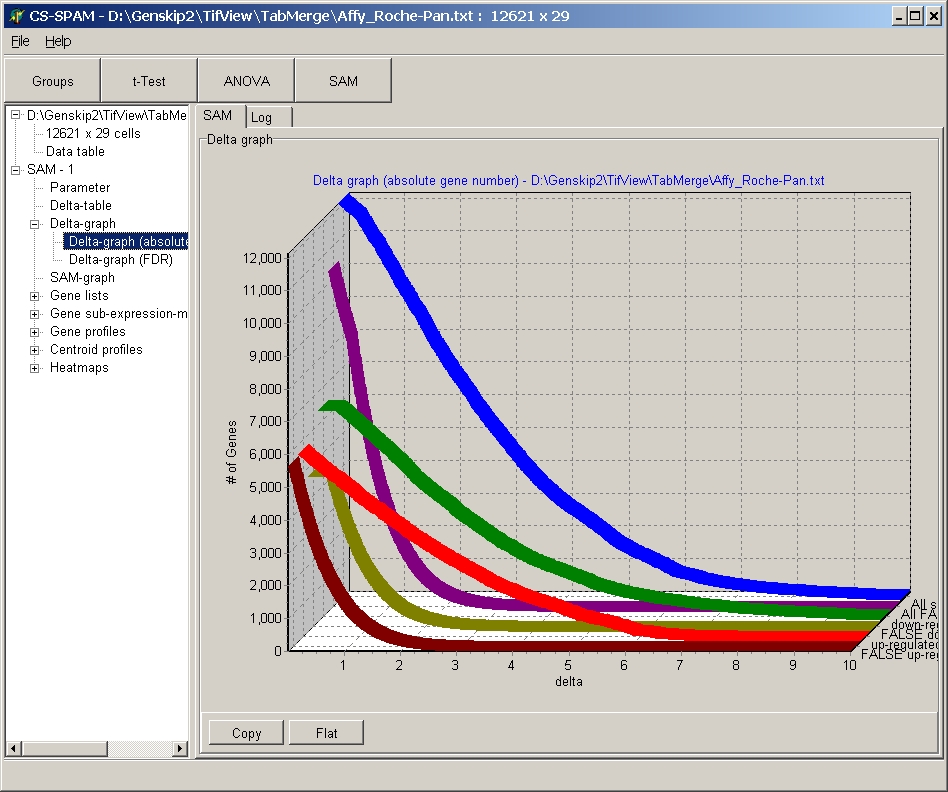
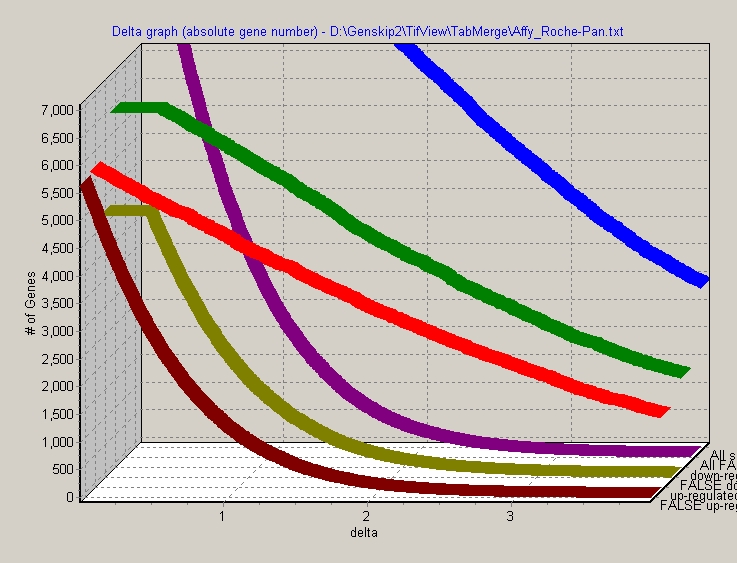
Click the Flat / 3-D button to switch between the different displays:
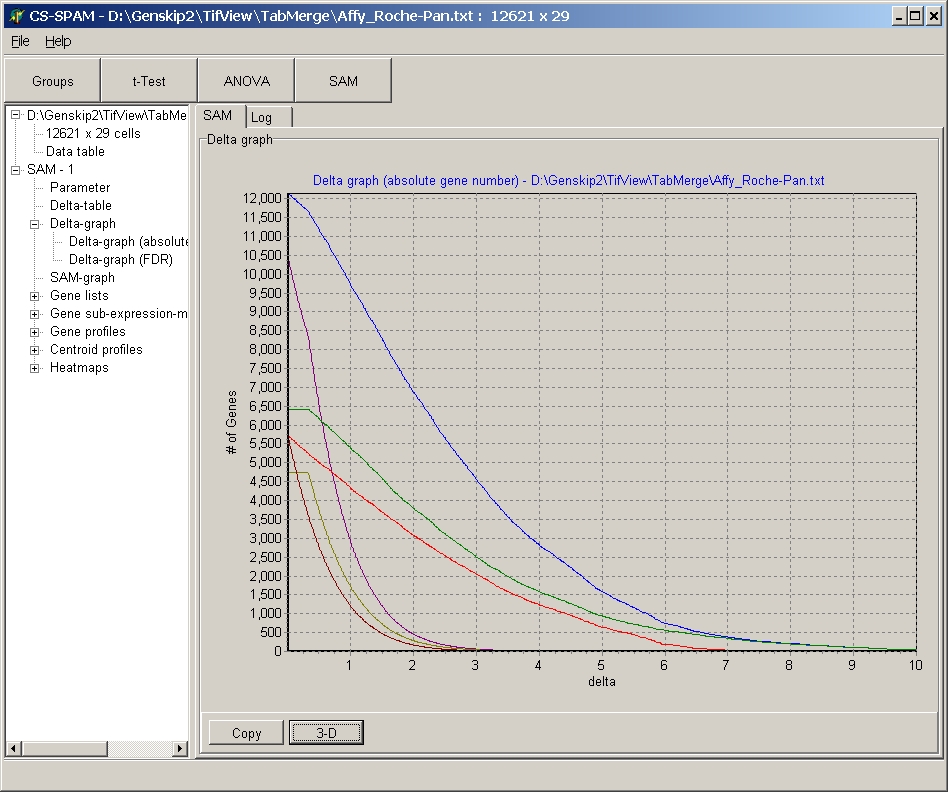
Click the copy button to capture the Line graph and put it into clipboard. Now it may be inserted into any other MS Windows application (e.g. Photo editor, Word, ...):
Keep left mouse button pressed and drag a selection rectangle (up, left -> down, right). The selected region will be zoomed:
To reset zoom, drag a inverted selection rectangle with left mouse button pressed (right, bottom -> left, up).
To move in the zoomed view move mouse with right mouse button pressed.
View expression profiles of significant selected genes as
line profiles:
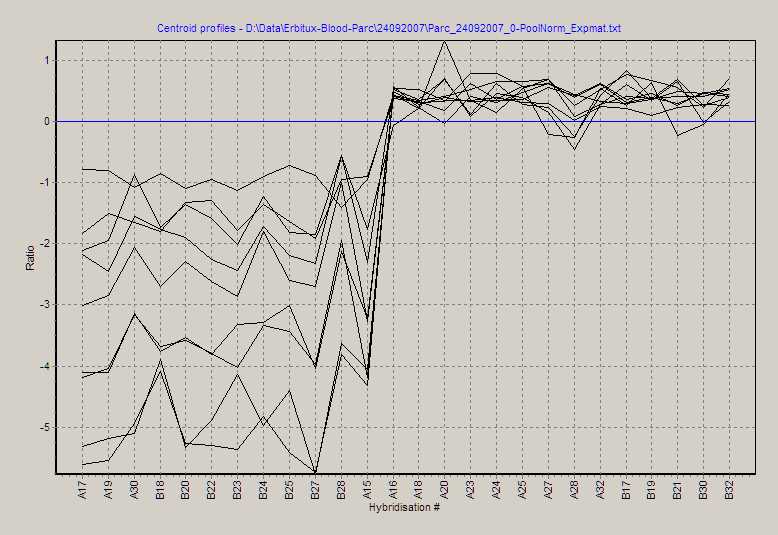
How to zoom and pan, see above.
View average profiles of significant selected genes as
line profile. The centroid is calculated by averaging all selected gene's
expression values at each single hybridisation, showing the overall expression
trend in the selected genes.
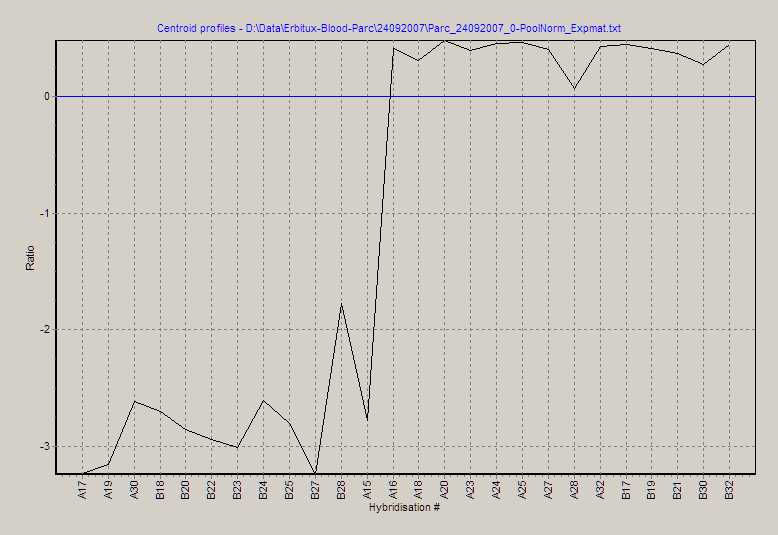
N.B.: The above centroid is calculated from the selected genes as
shown in the Gene profiles snapshot shown above.
How to zoom and pan, see above.
View expression sub-matrix of significant genes as usual heat map and perform subsequent clustering.
For example 2-class SAM significant up-regulated genes:
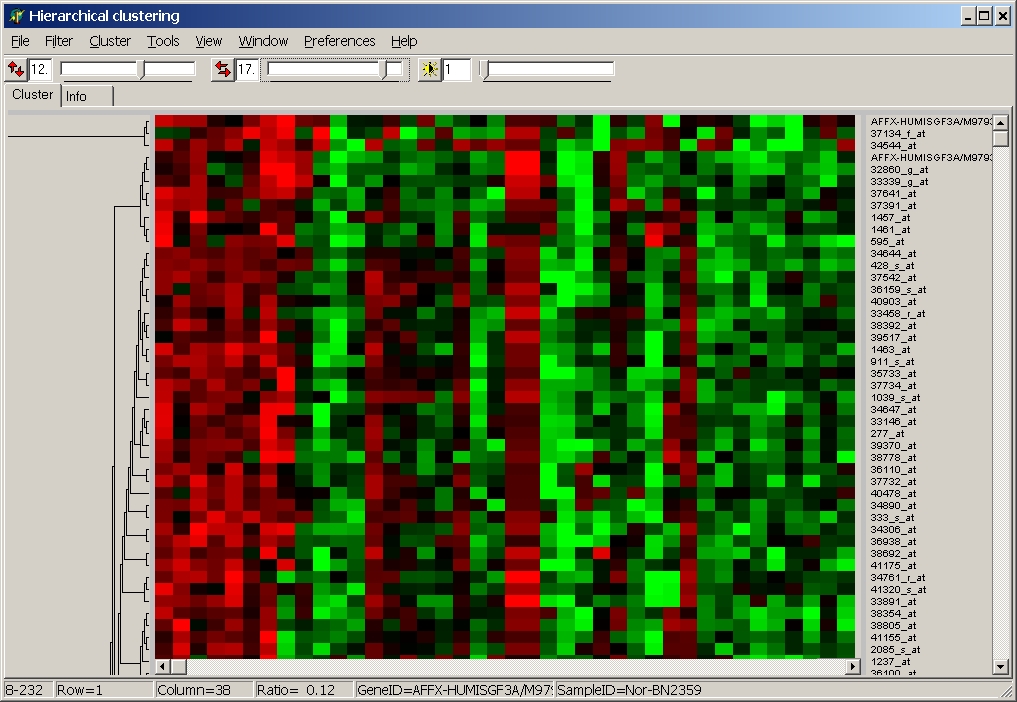
(NB: in this cluster only the first and last 10 hybs
have been used in SAM analysis)
For more details about the Heat map viewer / cluster tool go here.
last edited 31.10.2007