Feature lists => Matrix

Herre you find a set of tools to generates a two dimensional matrix from series of Key-Value pairs.


Feature lists => Matrix

Lets assume you have a series of Key-Values pairs: "Gene <=> Tumor entity".

First step extract UNIQUE
- Tumor Entities => X-dimension (columns)
- Genes => Y-Dimension (rows).
are extracted.

Second step the matrix is populated.
For each matrix cell the number of features(genes in rows) paired to a Sample (tumor entity in columns) is counted and assigned to the respective matrix cell.

Third step: Finally, the matrix is saved and may be analyzed.

Hierarchical clustering, statistic tests, visualizations, ... may be used to filter feature subsets related to sample groups.


The functionality may be applied to any kind of feature-value pairs:
- gene-tumor
- Actor/director-film genre
- plant/animal specie-country
- ...


Multiple lists => Matrix

Here we use a series of homomorphic files:

E.g. a list of vcf files, from genome/exome sequencing, variants extracted with varscan/mutect, annotated with annovar.
...
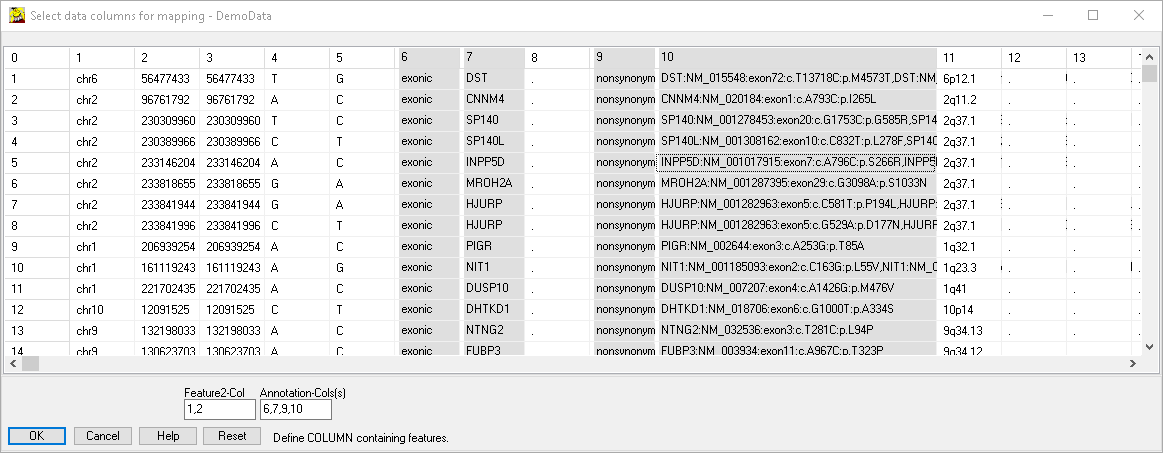
chr8	66429274	66429274	C	T	exonic	RRS1	.	nonsynonymous SNV	RRS1:NM_015169:exon1:c.C143T:p.T48I  8q13.1	...
chr8	66429276	66429276	G	A	exonic	RRS1	.	nonsynonymous SNV	RRS1:NM_015169:exon1:c.G145A:p.G49R  8q13.1	...
chr8	66429282	66429282	C	T	exonic	RRS1	.	nonsynonymous SNV	RRS1:NM_015169:exon1:c.C151T:p.R51W  8q13.1	...
...

Extract a matrix containing

Select SUMO main menu | Utilities | Feature list => Matrix | Multiple files => Matrix

Select multiple files (one per "sample").

A preview of the first selected file opens up:

Click one - or up to five columns (with Ctrl key pressed).
Click into FeatureCol text field.

To add additional
Annotation columns, select 1 - up to 10 - columns in the preview and click into the Annotation Col(s) text field.
Click OK-Button to assemble the matrix.

SUMO performs:
  1. Scan all selected list files and extract all unique keys and theri annotations
  2. Re-read the file, extract and increment the keys and the key counts for each individual sample to the matrix.
  3. Save the result matrix as tab delimited text file.

The result file looks like:
   
Keys	Anno1	Anno2	Anno3	Total-Count  AS-412869.vcf	AS-412870.vcf	_AS-412871.vcf ...
Total-counts  --	--	--	--  108	817	1504	3070  ...
...
chr1_100007135	SLC35A3  SLC35A3:NM_001271684:exon4:c.G444A:p.M148I	1p21.2	2  0	0	0	0  ...	
chr1_102965516	COL11A1  COL11A1:NM_080630:exon36:c.C2539T:p.P847S	1p21.1	1  0	0	0	0	
chr1_103754590	AMY1B  AMY1B:NM_001008218:exon7:c.G970A:p.G324R  1p21.1	1  0	0	0	1	...
chr1_1043688	AGRN	AGRN:NM_198576:exon9:c.G1754T:p.C585F		1p36.33	3  0	0	0	1	...
chr1_1044023	AGRN	AGRN:NM_198576:exon10:c.G1999A:p.A667T		1p36.33	1  0	0	1	1	...
chr1_10653830	CASZ1  CASZ1:NM_001079843:exon11:c.A2227G:p.T743A	1p36.22	1  0	0	0	1	...
...

Second row in the matrix contains count of non-zero cells for each repective sample/column.

In Log-tabsheet progress and basic count statistics are shown.

In the example above, keys contain chromosome and base position wihtin a chromosome (Columns 1 + 2 frome the source vcf files).
Thus we cann see number of SNPs wihtin an Exon/ gene.
But information, wheter there are muliple variants per BP (e.g. A=>G, A=>T, ...) are lost.
To circumvent this, build key from Chromosome, Basposition, Ref-Base, Variant base to include all base conserinsn as well as IndDels on Reference or Variant.
Or use Gene, or Gene+Exon as Key to generate a Gene/Exon overview matrix.


Feature list => Expression Matrix

Here we supply a tab-delimited text file conaining two columns containing the key value pairs to construct the matrix.
A third data column is used to integrate and average a numerical value, e.g. Expression.