SUMO - NGS count statistics / distribution
Generate and view general descriptive statistitics and distribution graphs to analyze global changes in data composition between the conditions/samples.
The tools are primarily targeted to analyse NGS read count daten derived from library screening experiments (genome wide crispr/cas screens, barcoding),
but may be applied to any kind of data containing positive numbers.
Signed data may create bizarre results or result in program crahses.
Read count distribution
Severasl distrubtion graphs are generated:
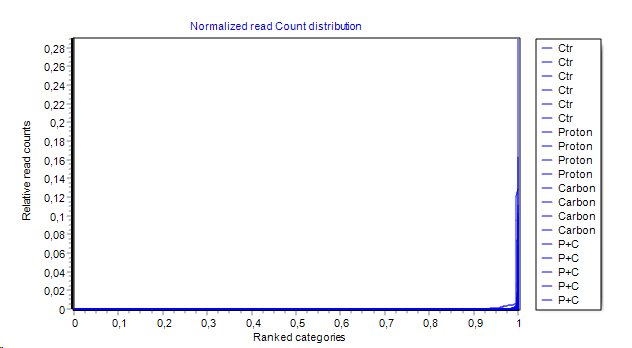
- Direct read count distribution:
- Features are ranked by their counts on x-axes
- respective read count on y-axes
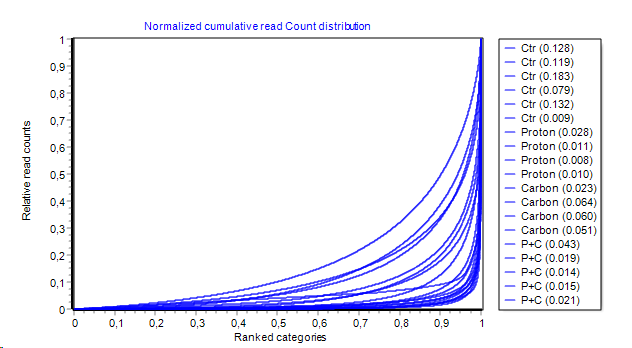
- Cumulative direct read count distribution:
Distribution from above is integrated channel-wise left to right
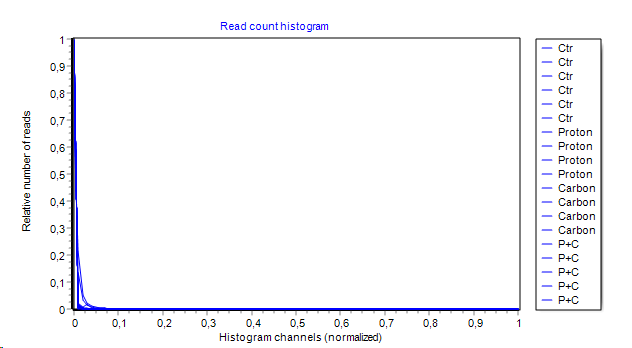
- Read count histogram:
A conventional histogram (100 channels by default) covering the whole read count range from all features/genes.
Number of features within each histogram-channel ist shown on y-axes.
Area Under the Curve (AUC) is computed and show (in brackets) in series legend.
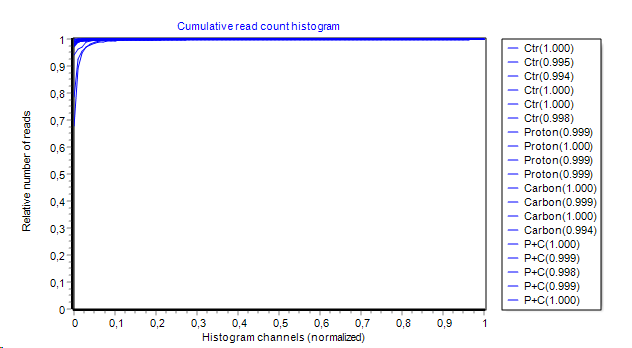
- Cumulative hisogram:
Histogram from above is integrated channel-wise left to right.
Area Under the Curve (AUC) is computed and show (in brackets) in series legend.
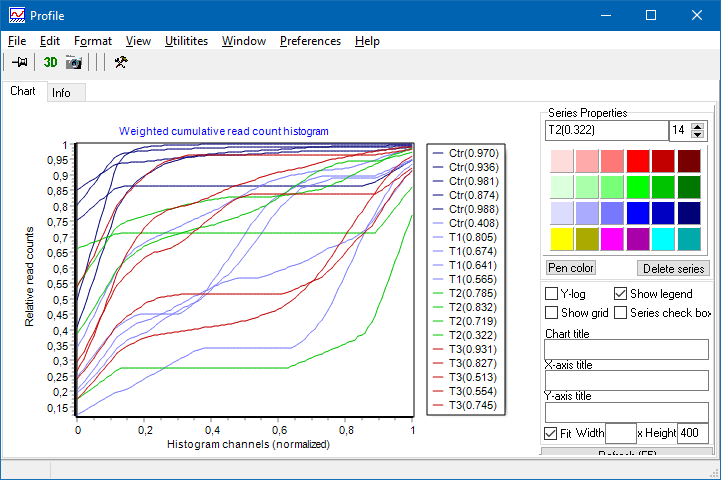
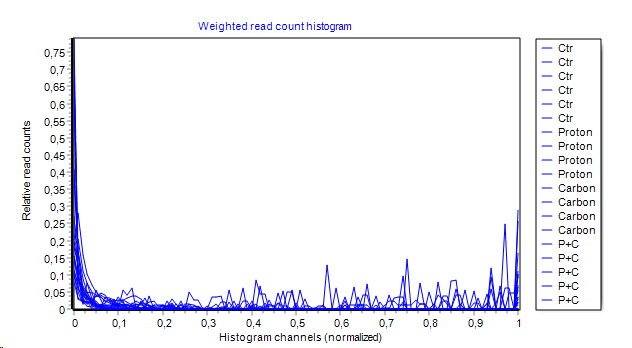
- Read count weighted hisogram:
A histogram is constructed. Instead od summing up the number of features in a histogram channel, the COUNT NUMBERs of all features within each channel are summed up and shown on y-axes.
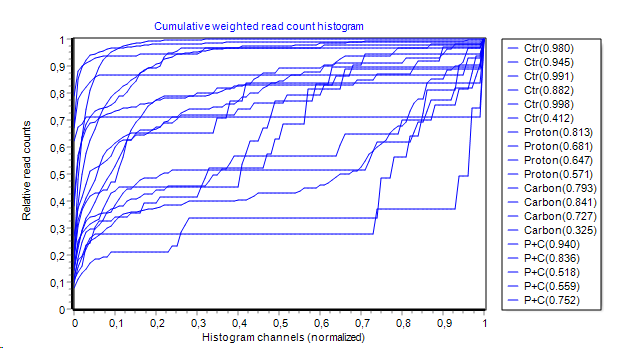
- Cumulative weighted hisogram:
Histogram from above is integrated channel-wise left to right.
Area Under the Curve (AUC) is computed and show (in brackets) in series legend.
All gaphs are normalied to 1 - x-/y-axes - to allow direct comparison of distributions from conditions with varying number of features(genes) / total intensity (count number ~DNA amount).
Customize the graph using ProfileViewer's
- tool box (Toolbar | "Hammer" button)
- Chart editor (Main menu | Edit | Chart editor)
- basic signal processing, e.g. smoothing (Main menu | Edit | Transform data)