To calculate SAM quantitative response / PTM a reference
profile to which gene expression data shall be correlated has to be defined.
Beneath using a predefined profile loaded with the expression matrix you can
freely such a preloaded profile or freely generate your own profile.
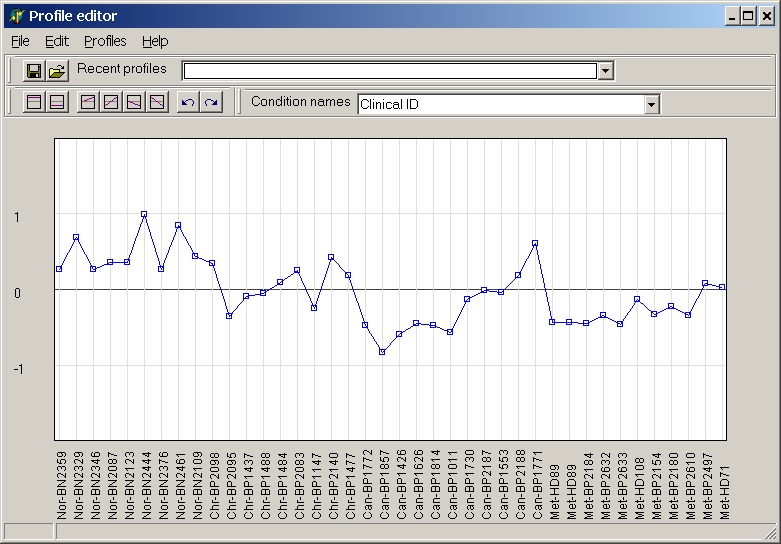
The template editor shows the preloaded profile - or a straight line if no
profile was previously loaded:
The graph shows the profile. Below the profile chart the hybridisation names are shown.
See more details about
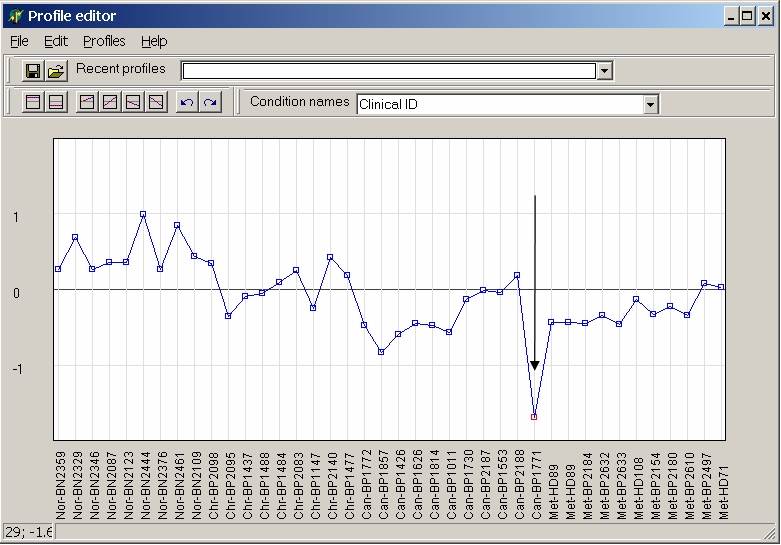
To change a single value click into the graph to select a value and move the mouse while keeping left mouse button pressed:
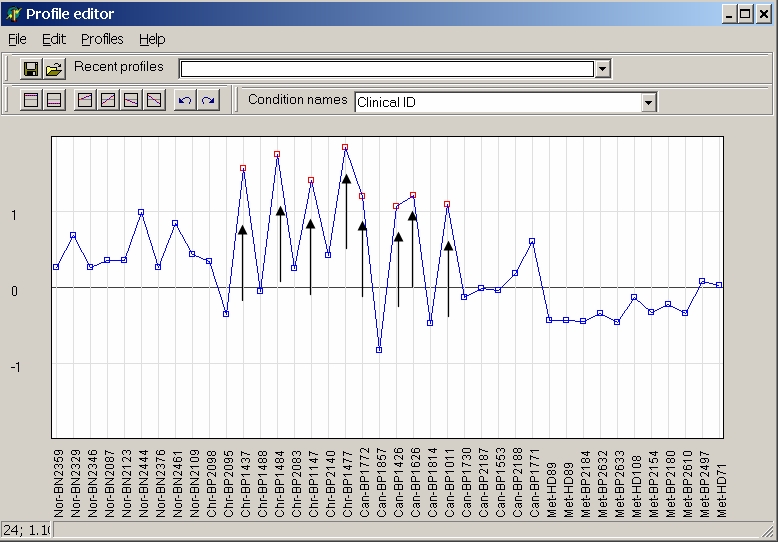
To change multiple values click onto multiple values while keeping Ctrl-key pressed, and change all selected values simultaneopusly by moving the mouse keeping left mouse button pressed:
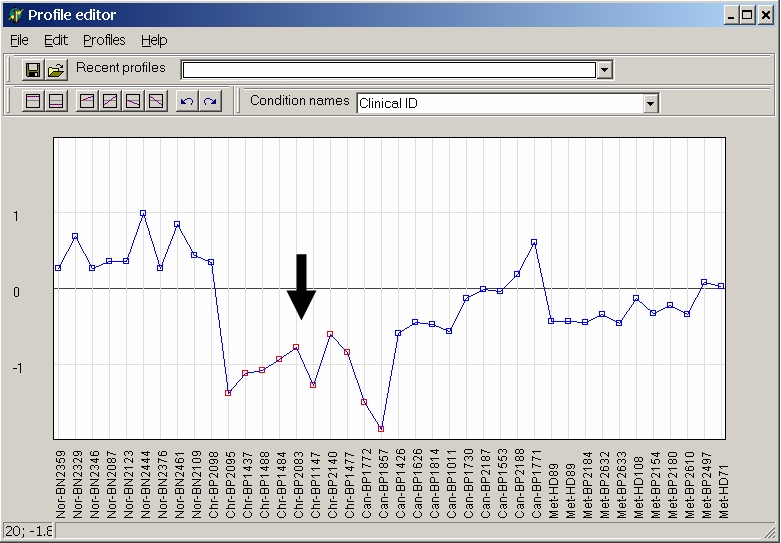
Or select first hybridisation and click last hybridisation while keeping Shift-key pressed to select and cahnge a contiguous range of hybridisation:
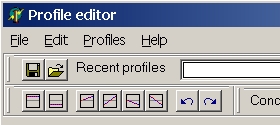
From the tool bar you can selecte a view preset basic profiles:
| |
Constant up: |
| |
Constant down: |
| |
Up-regulated |
| |
From down => up-regulated |
| |
down-regulated |
| |
From up => down-regulated |
| |
Shift pattern one channel left |
| |
Shift pattern one channel right |

To save a profile click the "Discette" button.
Profiles are saved with extensions " *.prf " in a binary format.
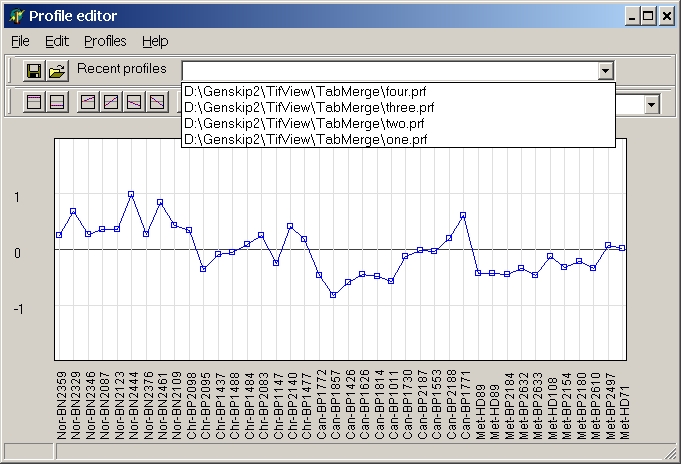
To load a profile click the "Open folder" button and select a previously saved profile.
To re-use a recently used profile open the "Recent profiles" drop down list and select any of the listed profiles:
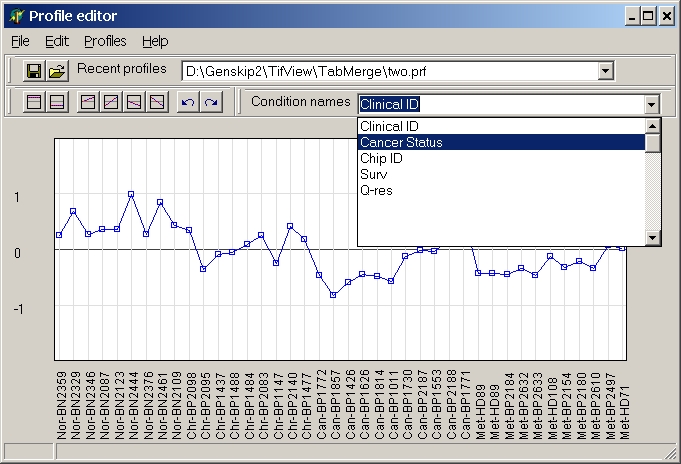
In case multiple header rows are loaded with the expression matrix, you can select any of the header rows for naming the hybridisations to allow more easy association of the profile to hybridisations.
Open the Condition names drop down list and select any of the availabel header rows:
last edited 05.05.2006