SUMO - Coepression / relevance networks
Wikipedia, the free encyclopedia explains:
"A gene co-expression network (GCN) is an undirected graph, where each node corresponds to a gene, and a pair of nodes is connected with an edge if there is a significant co-expression relationship between them.
Having gene expression profiles of a number of genes for several samples or experimental conditions, a gene co-expression network can be constructed by looking for pairs of genes which show a similar expression pattern across samples ... Gene co-expression networks are of biological interest since co-expressed genes are controlled by the same transcriptional regulatory program, functionally related, or members of the same pathway or protein complex.
The direction and type of co-expression relationships are not determined in gene co-expression networks; whereas in a gene regulatory network (GRN) a directed edge connects two genes, representing a biochemical process such as a reaction, transformation, interaction, activation or inhibition.[3] Compared to a GRN, a GCN does not attempt to infer the causality relationships between genes and in a GCN the edges represent only a correlation or dependency relationship among genes.
Modules or the highly connected subgraphs in gene co-expression networks correspond to clusters of genes that have a similar function or involve in a common biological process which causes many interactions among themselves
Analysis process
0. Data filtering
Like with any other anaylsis method, it may be recommended to remove features with low information content:
- low overall signal strength (abundane): e.g. average count <10 for RNA-Seq, or average intensity <100 for Microarrays.
- low variance across features
Low informative features comsume CPU-time and memory.
In the worse case they may generate fake coexpression, e.g. batch effects on non-expressed (~zero expressed) genes.
1. Similarity / distance analysis
As a first step, we compute pairwise similarity / distance between all features (rows) of the loaded data matrix.
If you prefer to analyze similiarites between conditions (colums), just transpose the matrix (SUMO main menu | Adjust data | Transpose matrix).
Here we can use same distance metrices as in clustering applications:
- preferably, correlation based distances: Pierson, Spearman, Kendall's Tau
- geometric distance: Eucledian, Manhatten, Canberrra, ..,
A distance Matrix with dimension (FeatureNumber x FeatureNumber) is computed and saved.
Computation is quadratic in computation time and memory consumption:
1000 feature => seconds, ~5 MB RAM
10000 features => minutes, ~500 MB RAM
2. Filtering
Define a threshold coepression value and extract best pairwise coexpresson as interaction list.
This list may be used for building interaction networks, e.g. with SUMO's Network builder,
or other network building tools.
Source data
1 matrix
Analyze coexpression between e.g. genes.
Load a data matrix into SUMO.
Select: Main menu | Analyze | Coexpression / relevance networks | One matrix
2 matrices
Analyze correlations between e.g. genes and miRNAs.
Both matrices MUST have same
- X-dimension (Number of columns).
- order of conditions (e.g. identical timepoints / treatments / ...).
Load a data matrix into SUMO.
Select: Main menu | Analyze | Coexpression / relevance networks | Two matrices
Select a second matrix.
Parameters
A parameter dialog opens up:
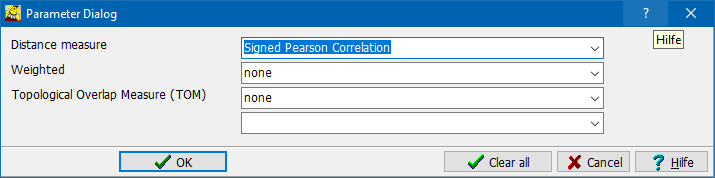
Select:
Distance metric:
- Preferably correlation based distances: Pierson, Spearman, Kendall's Tau
- signed correlation: to separate correlating from anticorrelating features
- Unsigned correlation: filter somewhow correlating features.
- geometric distances: Eucledian, Manhatten, Canberrra, ..,
always unsigned.
Distances are scaled to the interval 0 (=no similarity, anticorrelating) .. 1 (=identity)
Weighted: Perform non linear weighting to better distinguish similar <=> dissimilar features.
TOM = Topological Overlap measure.
Applicable to problems 1-matrix or 2-matrix with identical y-dimension problems.
TOM is highly computing instensive and consumes even more ressorces than distance computation.
Click OK-Button to start the analysis.
Filtering of relevant coexpression pairs.
A dialog opens up:
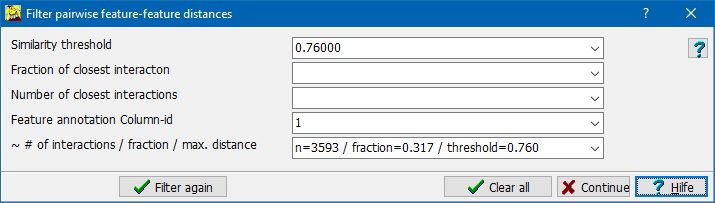
After computing of the distance matrix, SUMO tries to find and sugges6t a threshold similarity/distance value, which would generate a network with scale-free topology.
Specify a threshold:
- Threshold: definie a distinct smilarity value.
All features with Similariy >= threshold are accepted as interactions.
All others are discarded.
If you define ths value, the other two are ginored.
- Fraction of most similar coexpressions: Define e.g. "0.1":
The 10% "best" correlating feature pairs are exported, independant of abolut similrity value.
In case you have only non-correlating featues (similarity~0) you still would filter 10% of the least dissimilar features
Others discarded.
Number of Most similar coexpressions: Define "1000" to get the 1000 "best correlating features.
In case you have only non-correlating featues ...
- Feature annotation Column-ID: Used to extract feature names from loaded "expression" matrices and exported into the interaction list.
- ~ # of interactions / fraction / max distance: Filtering result information (chane has no effect):
Applying the presently defined filter you would get:
- number of filtered pairs n=xxxx (in the example n=3593)
- reflecting a fraction from all interactions (fraction=0.317 in the example)
- at a similarity threshold (threeshold=0.760 in the example).
Adjust the filter values.
Click Filter again button and see how numbers are changing.
Click Coninue button to save similarity matrix and interaction list.
Refilter similarity matrix
Reopen a saved similarity matrix.
Use the filtering process again to extract e.g.
- less - but more significant pairs
- more - but less significant pairs
and save another interaction list.