- DNA : characters A,C,G,T,U
- Protein one letter codes : A,R,N,D,C,Q,E,G,H,I,L,K,M,F,P,S,T,W,Y,V,B,X,Z
- "Gaps" : '.', '-'
- !! ANY OTHER CHARACTERS: IGNORED !!
- SUMO tries to estimate the sequence type on residue character composition
- As plain text:
- One sequence per line
- Only residue characters or "gaps"
- no sequence names, counting, spaces, tabs, ...
------gatTCTCACGTCG
-----cgatATAGAGCTAT
----tcgatTAGCATATGT
---atcgatCGTCTATGTC
--gatcgatCACGCACAGA
-cgatcgatACAGCGTGCA
acgatcgatTGTCTCAGAG
--------tCGACTCATCT
-------atAGCGTCGTCT
------.gatCGACGTGAC
.....cgatCTATAGCGTA
- Multiple FASTA:
- For each sequence ONE header line starting with ">"
- Followed by one or multiple sequence lines,
- only residue characters and "gaps"
>S-2_;
........NGATAGACTATACTACTGACTGCAGTCTGAGTCTGACAG.CG
ATCTCGATCGATACTACTATGTAGCAGAG.CTACGCACTCTATGCTAGTA
CGCTATAGATCN.............................
>S-2590_;
.........NATCTACACGTGCACTGACTGCAGTCTGAGTCTGACAGTCG
AT..CGAT....ACTACTATGTAGCAGAG.CTACGCACTCTATGCTAGCG
.ACGTGAGAATCAGATCGNA...............T.....
>S-232_;
..........NTATAGAGTACTACTGACTGCAGTCTGAGTCTGACAGG..
.....................TAGCAGAG.CTACGCACTCTATGCTAGAG
ACGACGCTAT..AGATCGGAAGAGCGGTTCAGCAGGANT...........
.........................................
>S-1712_;
..........NTCTGAGCTAGAACTGACTGCAGTCTGAGTCTGACAGG..
........................CAGAG.CTACGCACTCTATGCTAGGC
.GCTATCTGAT.AGATCGGAAGAGCGGTTCAGCAGGAATGN
>S-2233_;
......NTCGATTGCGCGTCTAACTGACTGCAGTCTGAGTCTGACAG...
......................AGCAGAG.CTACGCACTCTATGCTAGGA
.CATAGACGATC.GAT.AGATCGGAAGAGCGGTTCAN....
>S-1264_;
...NCGATCGATTAGTAGCTACACTGACTGCAGTCTGAGTCTGACAG...
....................CTAGCAGAG.CTACGCACTCTATGCTAGCA
.CTGAGACAATC.GAT.CGTAGATCGGAAGA..........
- Clustal format:
- The first line starts with the word
CLUSTAL W or CLUSTALW
- After the above header there is at least one empty line
- Finally, one or more blocks of sequence data are following, where each block is separated by at least one empty line.
- Each line in a blocks of sequence data consists of the sequence name followed by the sequence symbols, separated by at least one whitespace character.
- Optionally, an additional whitespace separated cumulative residue count may follow the sequence symbols - ignored.
- Optionally, a block may be followed by a line depicting the degree of conservation of the respective alignment columns - ignored.clustalw.aln S-232__ -------NTATAGAGTACTACTGACTGCAGTCTGAGTCTGACAGG--------------- S-2233__ ---NTCGATTGCGCGTCTAACTGACTGCAGTCTGAGTCTGACAG---------------- S-1264__ NCGATCGATTAGTAGCTACACTGACTGCAGTCTGAGTCTGACAGC--------------- S-1712__ -------NTCTGAGCTAGAACTGACTGCAGTCTGAGTCTGACAG---------------- S-2__ -----NGATAGACTATACTACTGACTGCAGTCTGAGTCTGACAGCGATCTCGATCGATAC S-2590__ ------NATCTACACGTGCACTGACTGCAGTCTGAGTCTGACAG-----TCGATCGATAC * ************************* S-232__ -------TAGCAGAGCTACGCACTCTATGCTAG-----AGACGACGCTATAGATCGGAAG S-2233__ --------AGCAGAGCTACGCACTCTATGCTAGGACATAGACGAT-CGATAGATCGGAAG S-1264__ -------TAGCAGAGCTACGCACTCTATGCTAG-----CACTGAGACAATCGATCG-TAG S-1712__ ---------GCAGAGCTACGCACTCTATGCTAG-----GCGCTATCTGATAGATCGGAAG S-2__ TACTATGTAGCAGAGCTACGCACTCTATGCTAGT-----ACG----CTATAGATCN---- S-2590__ TACTATGTAGCAGAGCTACGCACTCTATGCTAGCG----ACGTGAGAATCAGATCGNAT- ************************ : .****.
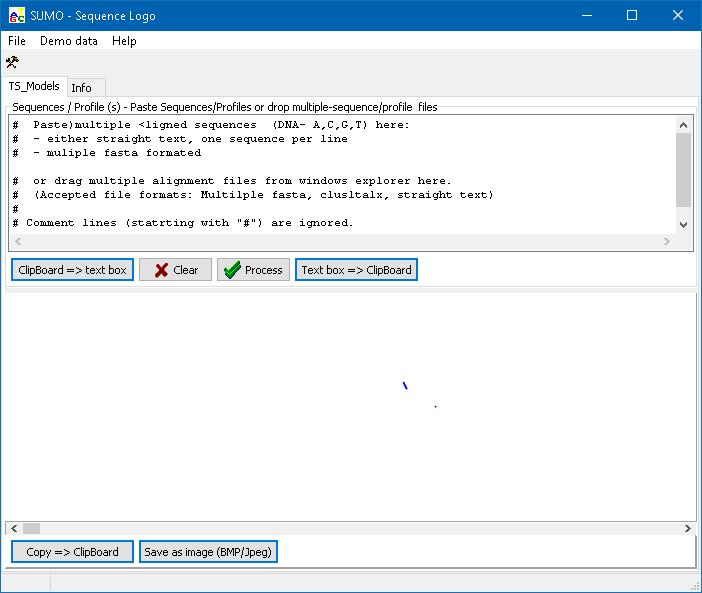
Paste a set of aligned sequences from clipboard ( Clipboard => text box button or drag a multiple alignment file from Windows' file explorer into the Sequence text box.
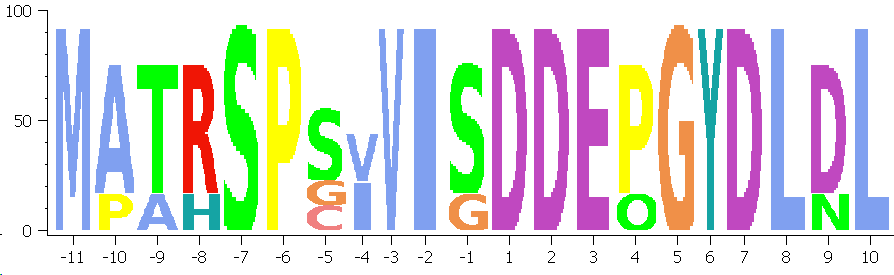
Click the Process button to generate the Sequence logo:
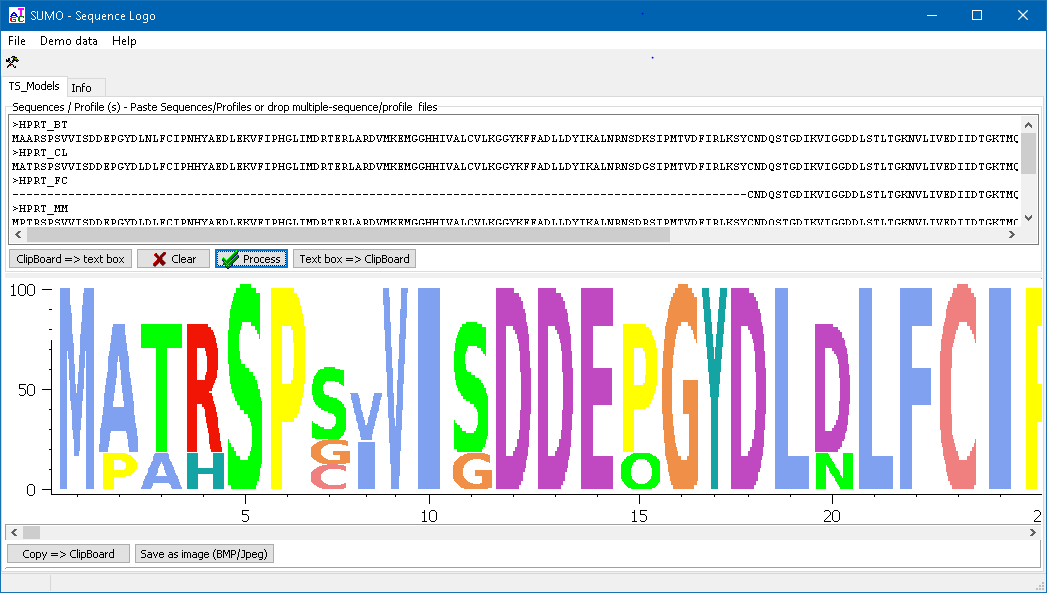
Copy the graph to Clipboard or save as image file.
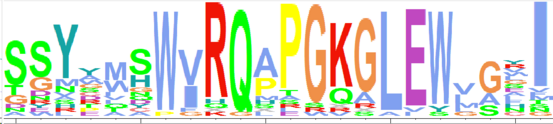
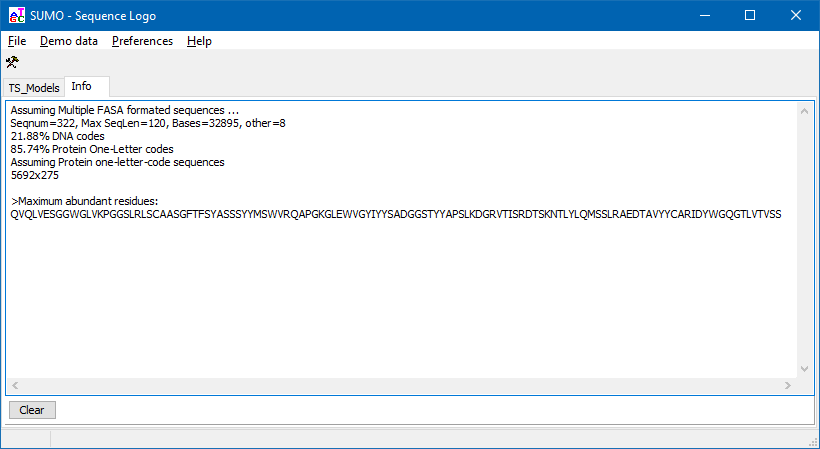
SUMO extracts a "majority" sequence from the multiple aligned sequences, taking the maximal abundant residue (i.e. character top in residue stacks) at each alingment positon. Kind of a "maximum intensity projection".
The resulting sequence is shown in Info tab-sheet, and may be copied from there:
Customize the graph
Click the Tool-button to view the tool-box: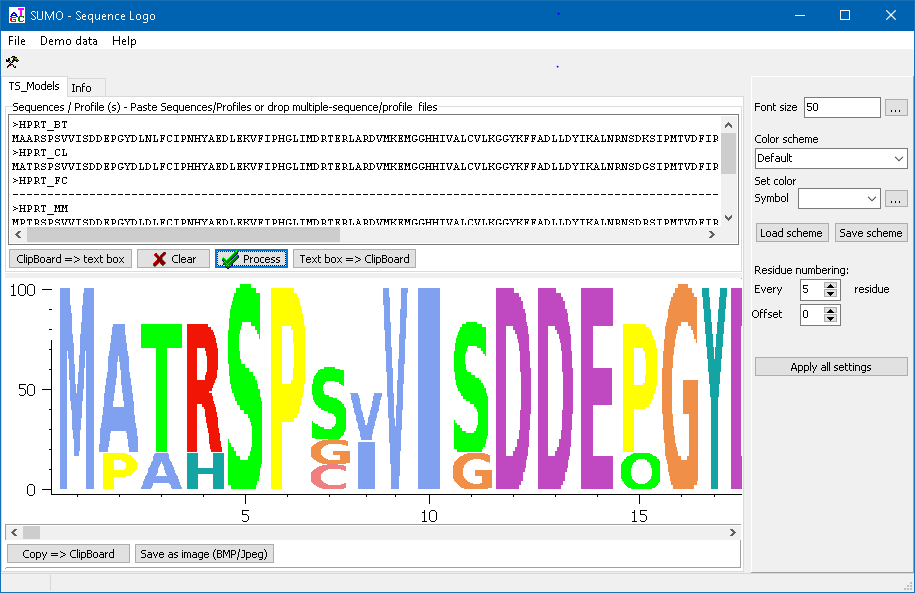
Font Size Change the font size. At present, minimum height/width of a character is limited to at least 10 pixels to allow readability. Click Apply button.
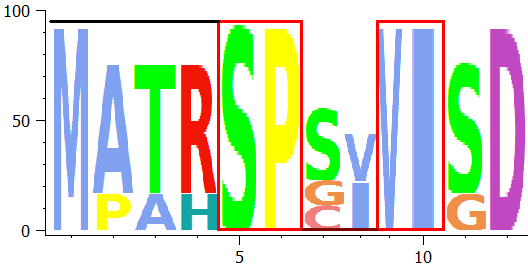
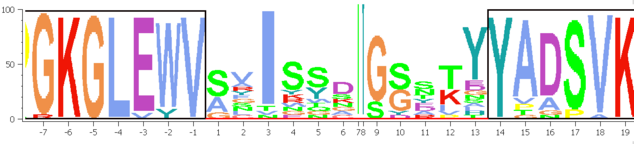
Residue numbering
Define the interval at which residure numbers are shone on x-axis.
"1" for every residue, "5" for every fith residue ...
Offset
Maybe you want to indicate the offstream residues relative to a certain feature.
The resdiues until OFFSET are counted negative, numbers at offset start with 1:
Color scheme Select different color schemes to visualize certain - conserved - properties of the sequences (e.g. hydophobity of amino acids in protein alignments).
Residue Colour Schemes