A tool to find genes which might predict differential survival when patients from a group are divided in up-/down-regulated subgroups.
Assume your hybridisations are from a set of
patients with defined survival and censoring state.
Survival scan calculates Mean and Standard Deviation of regulation from all
selected patients.
Next the group is sub-divided in two arms:
Up: Patients with significant up regulation compared to whole consortium
Down: Patients with significant down regulation compared to whole consortium
for all three subgroups (up/down/all) Kaplan-Meier curves and Median survival are computed.
Now you can filter those genes with predict differential survival in groupings
up <=> all
down <=> all
up <=> down
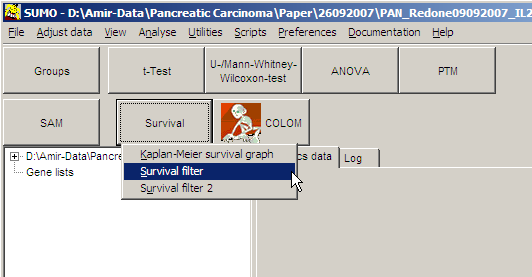
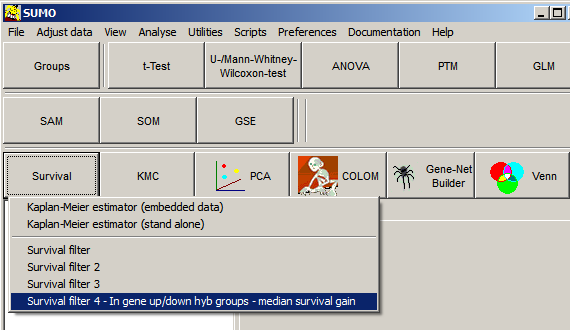
Click Survival button and Select
Survival filter from drop-down menu:
The Group selection dialog pops up.
Here you can define two groups:
Group 1 : The diagnostic group, i.e. those hybridisations (patients) which will be analysed and assigned to the two sub-classes
Group 2 : Additional hybridisations used to calculate reference survival data
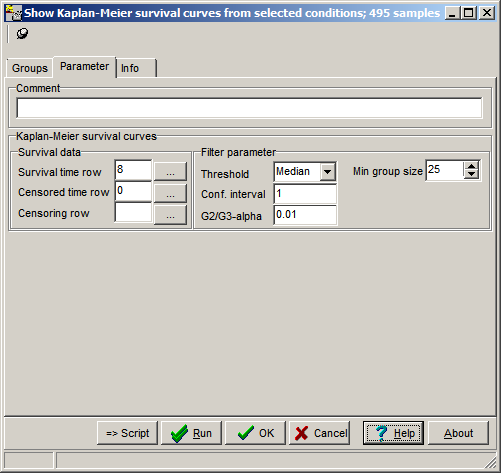
On the parameters tab-sheet define required
values:
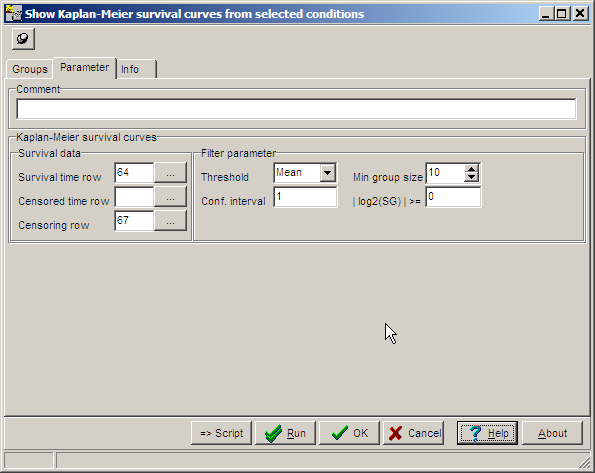
Survival time row, Censoring row like for calculation of Kaplan-Meier curves
Threshold: Algorithm how average expression for a single gene is calculates: Mean=arithmetic mean, Median= Median mean
Min.Group size: Minimum number of hybs (patients in the two sub-classes (up- / down-regulated)
Confidence interval: Number of standard deviations for thresholding
For each single gene the following steps are performed:
1. From all members of Group-1 calculate:
Average (either Mean or Median)
Standard Deviation
2. Assign members from group 1 to:
Class1: Up-regulated = Respective Hyb (patient) has expression value >= Average + (Conf.Interval * Standard-Deviation)
Class2: Down-regulated = Respective Hyb (patient) has expression value <= Average - (Conf.Interval * Standard-Deviation)
No-class: Not regulated = all other
3. Filter on Class-size: If (member-number from Class1 < Min.Group-Size) or (member-number from Class2 <Min.Group-Size) => ignore this gene
4. Compute median survival for members from Class1 (=MS1), Class2 (=MS2), Group1+Group2 (=MSR)
5. Compute survival-gain / -loss (SGL) factor:
SGL1 = MS1 / MSR, if SGL1>1 => SGL1 = 1/SGL1
SGL2 = MS2 / MSR, if SGL2>1 => SGL2 = 1/SGL2
SGL12 = MS1 / MS2, if SGL12>1 => SGL12 = 1/SGL12
These values are later on shown in the p-graph. As smaller the SGxx values, as larger the gain or loss of survival.
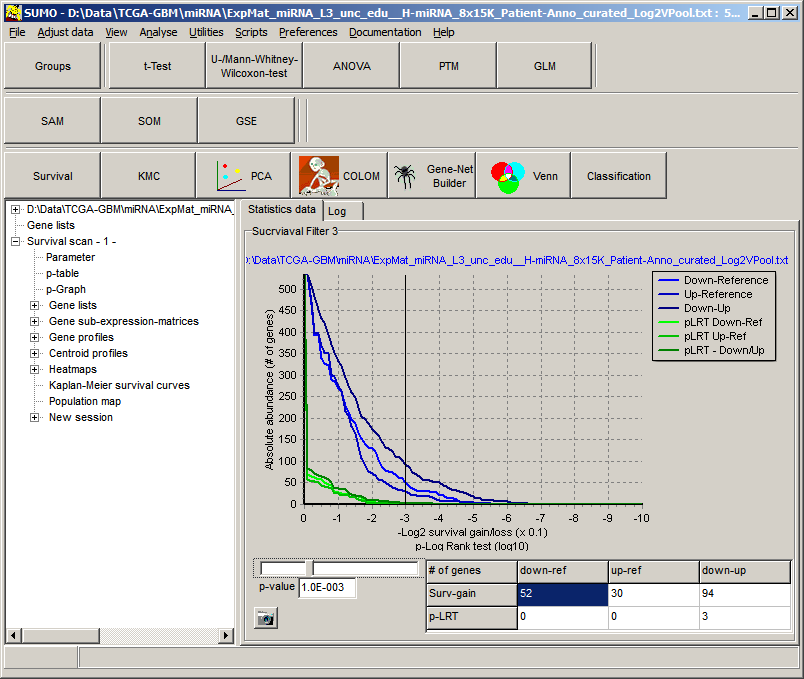
Open the analysis in the analysis tree.
On the p-graph adjust the gain / loss
factor (i.e. adjust the p-value slider).
For technical reasons the the p-graph was "misused and not correctly adapted.
Instead o the normal statistical p-value a gain loss factor is displayed (as
computed by SUMO, see above)
In the example: p=0.4 => onyl genes with loss or gain of survival >= 60%
compared to the reference group will be selected.
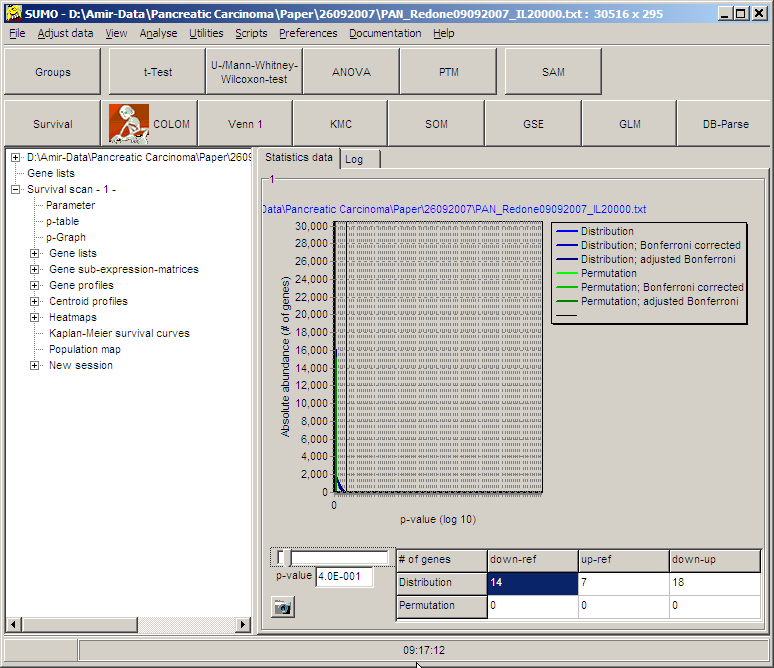
Select the SGL-class by selecting the respective field in the result table:
down<=>ref, up<=>ref, down<=>up (here: down-ref)
Click Kaplan-Meier survival curves in
the analysis-tree to view Kaplan-Meier curves from the filtered gene for the
three classes:
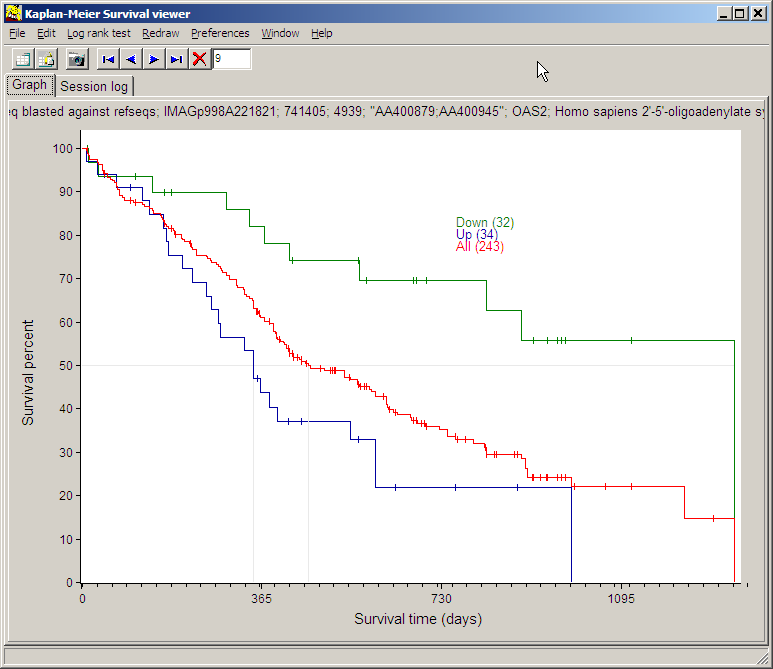
Use the navigation buttons (blue arrow buttons) to cycle through the filtered
genes.
Click Population map to visualise
which hybs (patients) are members of the Down-/Up-regulated class for the
individual filtered gene.
The population may be clustered like a regular heat map:
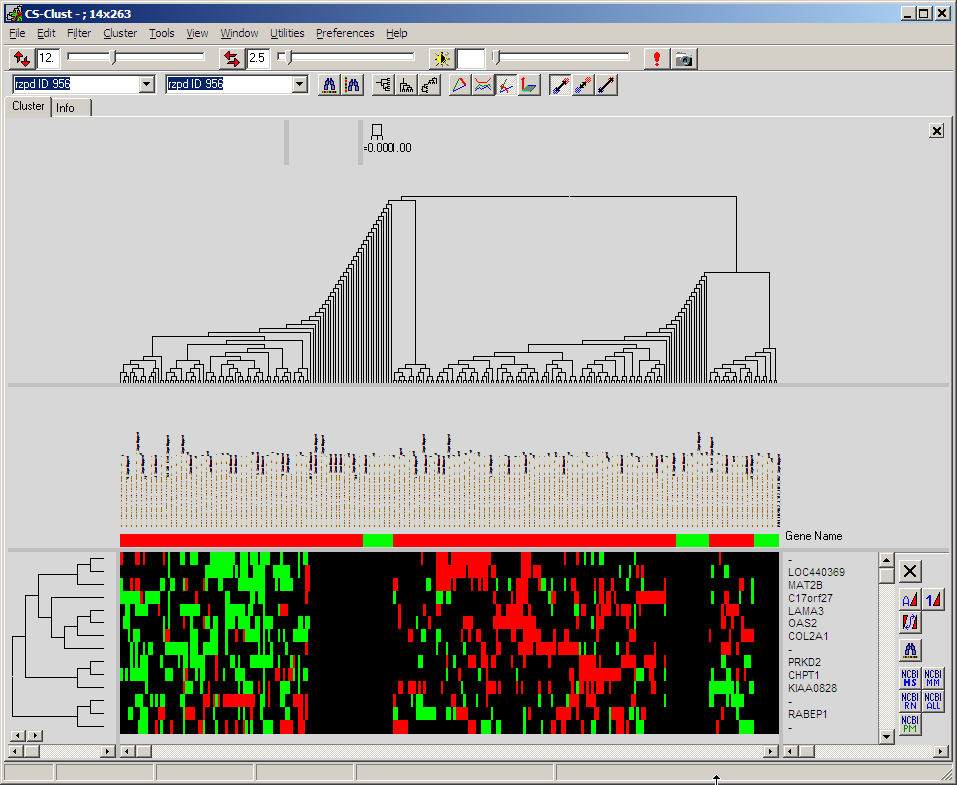
Colours indicate membership of a single hyb (patient) in a particular gene to
the two (up- / down-
regulated versus average) class.
Also all other functionality available for handling and analysing of heat maps
can be used.

Applied to 3 groups.
Find genes differentially regulated in patient group 2 <=> 3.
Try to find genes in group1 which might predict differential survival when
patients from group1 are divided in Group2/3 similar patients.
Assume your hybridisations are from a set of
patients with defined survival and censoring state.
Survival scan calculates Mean and Standard Deviation of regulation from all
selected patients.
Two patient groups can be defined with the
aim to find genes which are differentially regulated under patient parameters
which were used to sub-divide the two arms:
E.g. you have hybridisation from liver-tumour samples. Your patient annotations
contain information about Grading (=differntiation of tumour tissue:
1=differntiated=looks like normal liver ,...,3,4=undifferentiated no similarity
to normal liver)
A 2-class t-test without multiple testing correction is used to find differentially expressed genes at the defined critical p-value (G1G3-alpha) between Grade1 / Grade34 patients.
Next, the patients in group 2 (e.g. in our
example patients with Grade 2) are divided in those being more similar to the
Grade1 / Grade34 patients.
This is done by computing Mean and SDev between G1 / G34. Now, all patients
> M+Confidence range*SDev => Subgroup1
< M-Confidence range*SDev => Subgroup2
As above Kaplan-Meier, median surviaval and Log-Rank test are calculated for
Subgroup1/2 and Group1.
| Survival time row | Sample annotation row containing survival data Days, weeks, month, years wahtever. The row shold only contain NUMBERS (5 weeks is not a number and will be interpreted as 0) |
| Censored time row | Sample annotation row containing survival data for censored samples. Instead you may use the censoring row. |
| Censoring row | Sample annotation row containing consoring nformation, i.e. defines whether the individual died at that time point (Survival time point) or was lost from the study without further knowledge about survival. Use "yes", "ja", "c", "censored","1" to define a sampel as censored, anything else is interpreted as not censored. |
| Threshold | Define how to group the samples:
|
| G2/G3.alpha | not used |
| Min group size | The minimal number of samples per group (down/up regulated samples in a particular gene) |
| Name | Value (exsample) | Meaning |
|---|---|---|
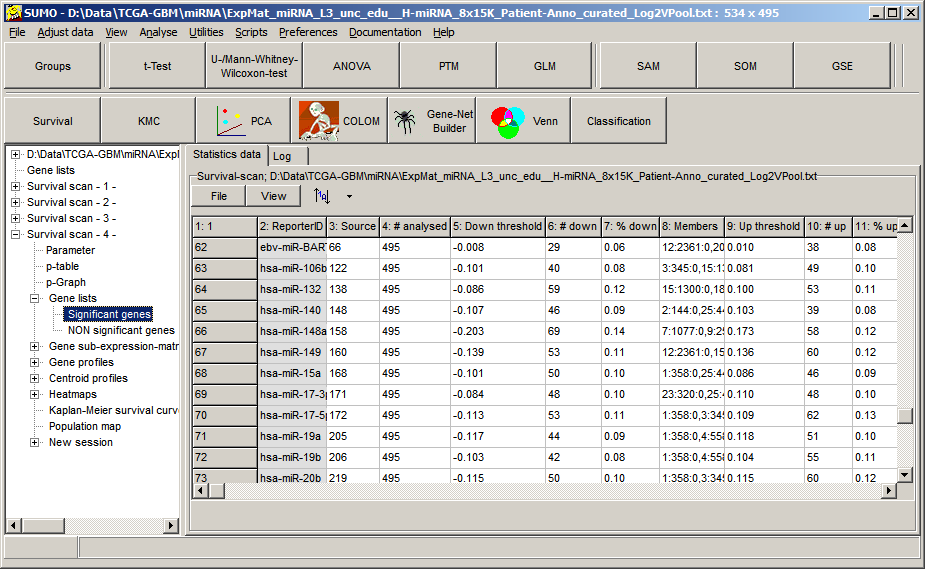
| ReporterID | ebv-miR-BART11-5p | Name of gene/.... |
| Source line # | 66 | Gene-ID in original data matrix |
| # analysed | 495 | Number of samples analyzed; shoud be identical for all genes |
| Down threshold | -0.008 | Threshold for down-regulated samples |
| # down | 29 | Number of down-regulated samples |
| % down | 0.06 | Number of down-regulated samples in % |
| Members | 12:2361:0,20:430:0,22:326:0,... | A data triplet for each sample within the group: Sample-ID:Survival-time:Censor-State e.g. "12:2361:0" - Sample 12, SUrvival time=2361 (days), not cnesored (0) |
| Up threshold | 0.010 | Threshold for up-regulated samples |
| # up | 38 | Number of up-regulated samples |
| % up | 0.08 | Number of up-regulated samples in % |
| Members | 1:358:0,5:705:0,6:322:0,39:167:0,... | Sample-IDs,Survival,Censorstate for all members |
| G1-Mean | -0.011 | Mean (arithmetic) regulation in Down-regulated samples (Group1) |
| G1-SDev | 0.002 | Standard deviation from regulation in Group1 |
| G2-Mean | 0.019 | Mean (arithmetic) regulation in Up-regulated samples (Group2) |
| G2-SDev | 0.016 | Standard deviation from regulation in Group2 |
| G1-G2 | -0.030 | Differential regulation (Mean-G1 - Mean-G2) |
| t-value | -11.538 | t-value (Students-t-test) with Welsh approximation) |
| p-value | 1.91E-014 | p-value from t-distribution with Sattertwaithe approximation) |
| #-reference | 383 | Number of samples used to compute reference Kaplan Meier Curve (KM) Sample numbers used for KM-data may differ from groupsize. Samples, for which there were NO survaval data in sample annotation, can not be used for survival data (obvious) |
| Members1 | 12 20 22 ... | List of sample-ID for G1; may be used to identidfy samples in Heatmap/ Group Selector |
| Members2 | 1 5 6 39 ... | List of sample-ID for G2 |
| Down-Median survival | 482.000 | Median survival in G1 |
| Up-Median survival | 350.000 | Median survival in G2 |
| Reference-Median survival | 377.000 | Median survival in ALL selectged samples (Ref) |
| Down/Reference log2-survival-gain | 0.782 | Compute: Ratio=MediaSurvial-G1 / Media_Survival-Ref This cell contains = absolute (log2 (Ratio)) Cell value=1 => The median-survival betwen the groups differs by factor 2x |
| Up/Reference log2-survival-gain | 0.928 | |
| Down/Up log2-survival-gain | 0.726 | |
| Down-Reference Log rank test | 1.037 | Log Rank Test (LRT) between G1<=>Ref (Down-Regulated<=>Ref) |
| Up-Reference Log rank test | 4.254 | Rank Test between G2<=>Ref (Up-Regulated<=>Ref) |
| Down-Up Log rank test | 5.952 | Rank Test between G1<=>G2 (Down<=>up-Regulated) |
| Down-Reference p-LRT | 1.00E+000 | p-value from LRT G1<=>Ref |
| Up-Reference p-LRT | 1.00E+000 | p-value from LRT G2<=>Ref |
| Down-Up p-LRT | 1.47E-002 | p-value from LRT G1<=>G2 |