Obviously, the above curves (distributions) are nicely separated, and thus we can assume, the expression ratio is different between cancer / healthy.
A basic question in any kind of experimental data production is:
are my measured data only noise from my measurement system or are they statistically significant
A very basic - and commonly used - test to determine this is a
T-Test.
This test answers the questions:
How probable is it that my measured data distribution is part of another distribution (e.g. noise).
Case 1: How probably is it that a single gene is regulated, or only part of stochastic noise in my data => Single class T-test
Case 2: How probably is it, that the observed regulation of a single gene is different in two sub-sets of patients (healthy - ill) => 2-class T-Test
Case 3: How probably is it, that the observed regulation of a single gene is able to distinguish between multiple sub-sets (lung - kidney - liver - brain) => Multi-class T-test or ANOVA
Case 4: Show paired samples (e.g. Control vs. Treated) same regulation trend ? => Paired samples 2 class test
Common to all these tests is the basic 2 class T-test:
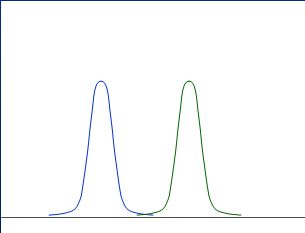
Assume two randomly Gaussian distributed measurements (e.g. expression ratios from 10 cancer and 10 healthy patients):
Obviously, the above curves (distributions) are nicely separated, and thus we
can assume, the expression ratio is different between cancer /
healthy.
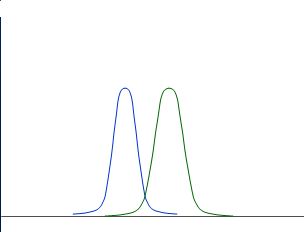
Also those distributions are nicely separated:
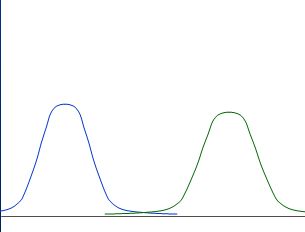
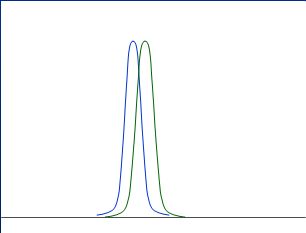
Whereas those are not nicely separated:
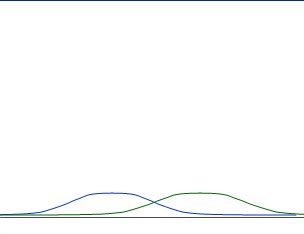
Good rules to describe nicely separated distribution might be:
as "fare away" as better
as "smaller" as better
A bit more formalised: calculate
average (M1 and M2 for the two distributions)
standad deviation (s1 and s2 for the two distributions)
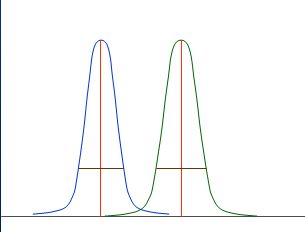
and calculate distance between averages (M1-M2) and divide by the weighted "widths" (s1+s2)
which gives you the t-value.
If you assume the distributions to be Gaussian like, you can directly transform
the t-vale into a p-value (probability value) based on the
t-distribution.
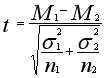
For 2-/Multi-class T-tests SUMO assumes un-equal group variances,
using above formula for T calculation and
Welch-Satterthwaite-Approximation for calculation of Degrees of
Freedom.
The p-value from a one-sided test is reported and gives you the probability, that the two distributions are identical, i.e. they have same average and standard deviation.
As smaller the p-value, as less similar the curves are.
In all tests we search genes with low small p-value.
Here we test, whether a single gene is different to a fixed value
(e.g. 0 regulation) in all selected hybridisations.
E.g. find genes which are highly regulated in all different cancer tissues
=> general impact for cancer.
In this case we assume M2=0 and S2=0, thus the T-test formula degenerates
to

All genes with low p-value are statistically significant regulated (i.e. either up- or down-regulated).
Here we test, whether paired
samples (e.g. Treatment1 vs. Treatment2 for each single patient) show the same
regulation trend (e.g. down- regulated from T1 -> T2).
We compute for each pair the difference and use a single class t-test to
estimate, whether the differences are statistically significantly positive or
negative.
Lets assume we have measured the expression of a single gene in several patients (n patients) after treatment with compound A and compund B, respectively.
First we compute the difference for each patient:
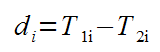
Next we compute the t-value:
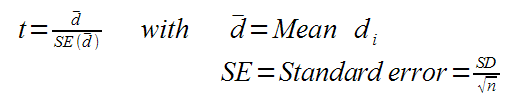
With t and n we can compute the p-value from a 1-class t-test against 0-regulation.
Here we test, whether a single gene is different to a fixed value
(e.g. 0 regulation) in all selected hybridisations.
E.g. find genes which are highly regulated in all different cancer tissues
=> general impact for cancer.
In this case we assume M2=0 and S2=0, thus the T-test formula degenerates
to
All genes with low p-value are statistically significant regulated (i.e. either up- or down-regulated).
Click the T-Test button
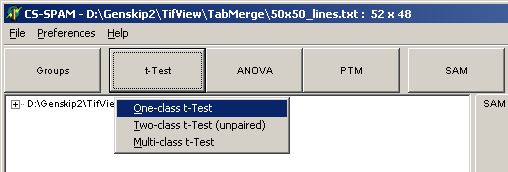
and select One-class t-Test
The parameter dialog-pops up
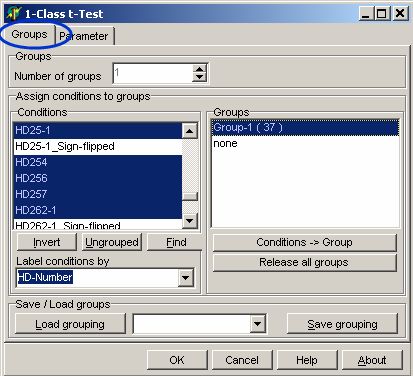
In the Groups tab-sheet select
all required hybridisations:
On the Parameter page
select:
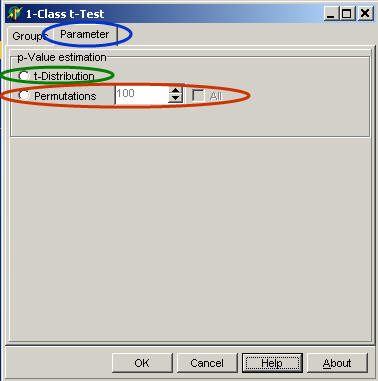
Select the algorithm how p-value is estimated:
T-distribution to derive p-values from T-distribution
Permutations and number of permutations to estimate the p-value using a permutation scheme
Click OK button, and run the analysis.
In the experiment tree a new entry shows up:
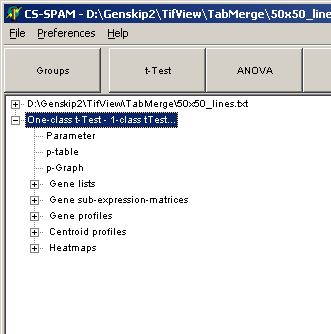
Click any of the listed items:
Set the critical p-value alphausing the p-Graph:
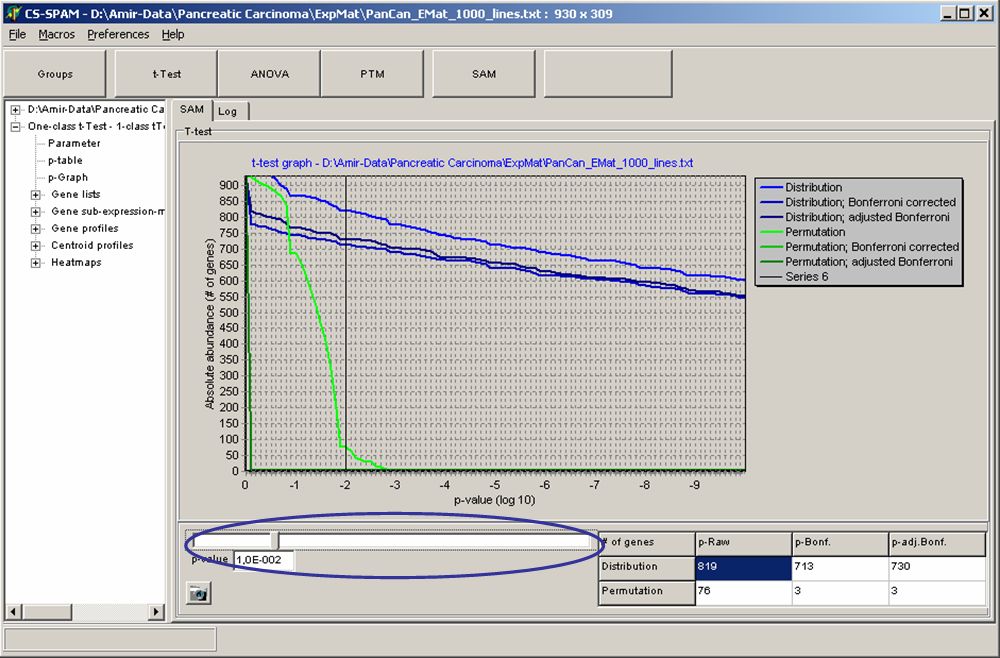
The Graph shows the number of matching genes (i.e. those with
corresponding p-values) in dependence of the p-value (here decadic
logarithm).
Blue curves show p-value
according to T-distribution, green
curves show p-values according to permutations.
The table show numbers of genes with p-values equal or smaller the set critical p-value.
Use the slider to adjust alpha and watch the changing number of genes in thetable.
Click the respective table field to use for subsequent data views. E.g. if you want to use the 713 genes which passed the Bonferroni corrected T-distribution test click the table cell Distribution / p-Bonf.
View the Parameter for this analysis
Analyse the different views of those genes which have p-values < alpha
Gene profiles
Centroid profiles
Heat maps
Save the matching genes
Gene lists: gene names and numerical T-Test values
Gene sub-expression matrices: Expression matrix including gene-expression values
Here we test, whether a single gene is different in two selected
sub-sets of our hybridisations (e.g. Cancer <=> Normal)
E.g. find genes which are clearly different regulated in the two sub-sets
(up<=>down or up<=>more up or down<=>more down).
Her we use the standard T-test formula:
All genes with low p-value are statistically significant regulated
(i.e. either up- or down-regulated).
Click the T-Test button
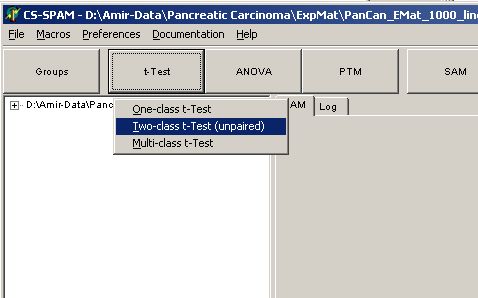
and select Two-class t-Test
The parameter dialog-pops up
In the Groups tab-sheet select
all required hybridisations:
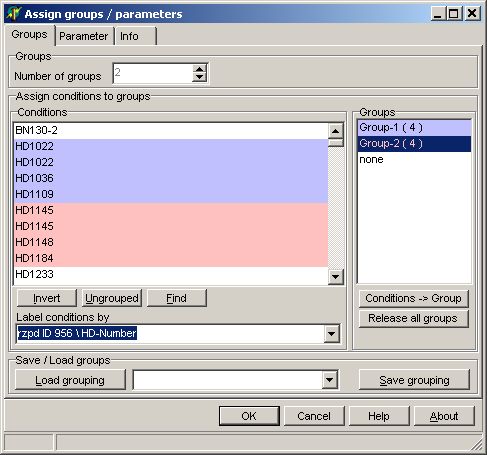
On the Parameter page
select:
Select the algorithm how p-value is estimated:
T-distribution to derive p-values from T-distribution
Permutations and number of permutations to estimate the p-value using a permutation scheme
Click OK button, and run the analysis.
In the experiment tree a new entry shows up:
Click any of the listed items:
Set the critical p-value alphausing the p-Graph:
The Graph shows the number of matching genes (i.e. those with
corresponding p-values) in dependence of the p-value (here decadic
logarithm).
Blue curves show p-value
according to T-distribution, green
curves show p-values according to permutations.
The table show numbers of genes with p-values equal or smaller the set critical p-value.
Use the slider to adjust alpha and watch the changing number of genes in thetable.
Click the respective table field to use for subsequent data
views. E.g. if you want to use the 713 genes which passed the Bonferroni
corrected T-distribution test click the table cell Distribution / p-Bonf.
View the Parameter for this analysis
Analyse the different views of those genes which have p-values <= alpha
Gene profiles
Centroid profiles
Heat maps
Save the matching genes
Gene lists: gene names and numerical T-Test values
Gene sub-expression matrices: Expression matrix including gene-expression values
Click the t-test button and select Two-class t-Test (paired samples)
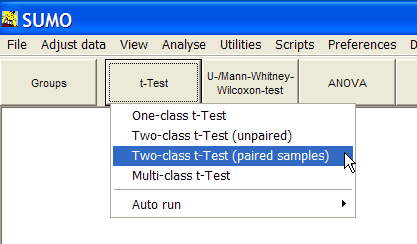
The parameter dialog-pops up:
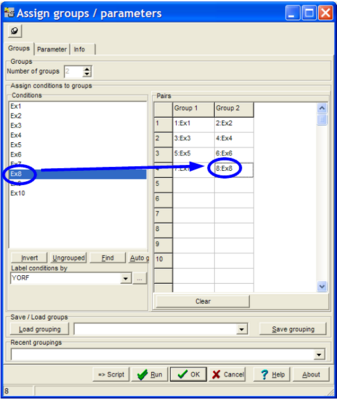
Assign the hybridisation pairwise to the two groups. Click a hyb in the Conditions list, then click the respective cell in the Pairs table.
Click the Clear button to empty the table.
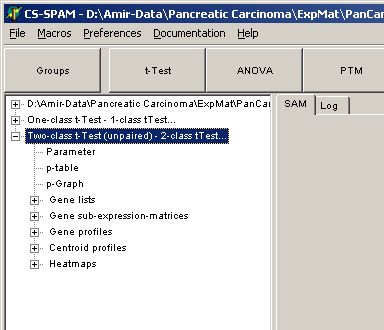
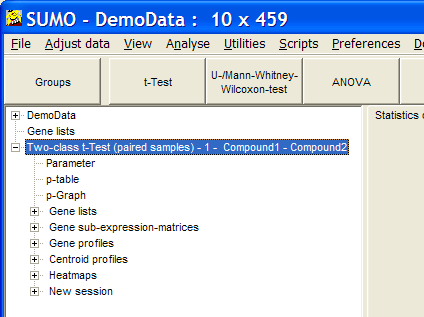
In the experiment tree a new entry shows up:When done, click the Run button to perform the test.
Go to p-graph and adjust critical, p-value.
As usual, show Gene list / sub-expression matrix / Gene / Centroid profiles or heatmap from the selected genes.
Here we test, whether a single gene is different between multiple
(3 or more) selected sub-sets of our hybridisations (e.g. Kidney <=>
Liver <=> Lung <=> Heart)
E.g. find genes which are clearly different regulated in any different grouping
of the four sub-sets (K-LLH or L-KLH or KH-LL ...).
To do this SUMO builds all possible 2-group unique combinations
of the sub set and performs for each combination a T-test. The lowest p-value
of any of the possible combinations is reported as p-value for this gene.
The number of combinations increases in the order of the Faculty
function. Therefore, the number of combinations becomes very large and
computational intensive with large numbers of sub sets. SUMO is limited to
handle a maximum of 9 groups.
A more flexible and less challenging way to analyse larger groups is ANOVA.
All genes with low p-value are statistically significantly able to
distinguish between the original sub-sets (in any way described above).
Click the T-Test button
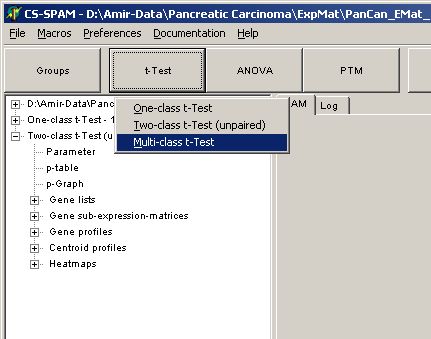
and select Multi-class t-Test
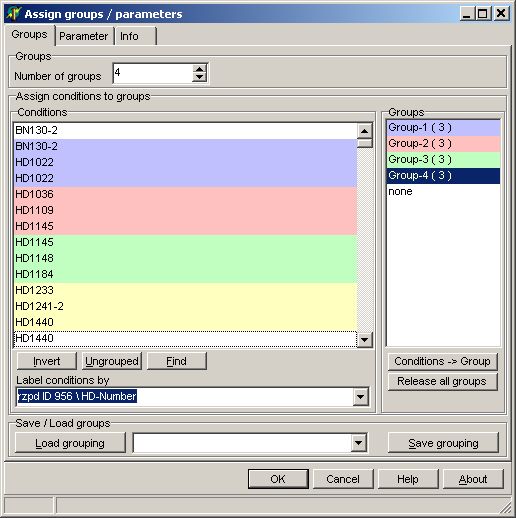
The parameter dialog-pops up
In the Groups tab-sheet select
all required hybridisations. Set the number to 3 or more:
On the Parameter page
select:
Select the algorithm how p-value is estimated:
T-distribution to derive p-values from T-distribution
Permutations and number of permutations to estimate the p-value using a permutation scheme (not implemented yet)
Click OK button, and run the analysis.
In the experiment tree a new entry shows up:
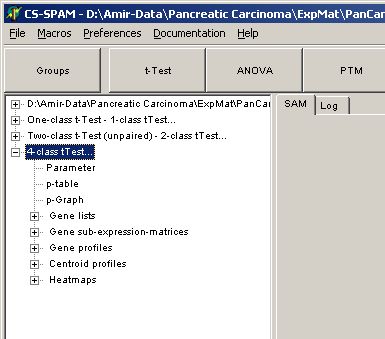
Click any of the listed items:
Set the critical p-value alphausing the p-Graph:
The Graph shows the number of matching genes (i.e. those with
corresponding p-values) in dependence of the p-value (here decadic
logarithm).
Blue curves show p-value
according to T-distribution, green
curves show p-values according to permutations.
The table show numbers of genes with p-values equal or smaller the set critical p-value.
Use the slider to adjust alpha and watch the changing number of genes in thetable.
Click the respective table field to use for subsequent data
views. E.g. if you want to use the 713 genes which passed the Bonferroni
corrected T-distribution test click the table cell Distribution / p-Bonf.
View the Parameter for this analysis
Analyse the different views of those genes which have p-values < alpha
Gene profiles
Centroid profiles
Heat maps
Save the matching genes
Gene lists: gene names and numerical T-Test values
Gene sub-expression matrices: Expression matrix including gene-expression values