This function allows to filter data on values derived from complete data columns.
An obvious strategy would e to filter data on constant values, e.g. spot intensity above a fixed value :
In the example a fixed threshold of 10 is used to filter data from 3 Hybridisations, not taking into consideration differencies in signal distributions of the individual hybridisations.
It might be more useful to calculate filtering thresholds for each hybrifdization individually.
This is what TableButler's column filter does.
TableButler shows a preview of the data file :
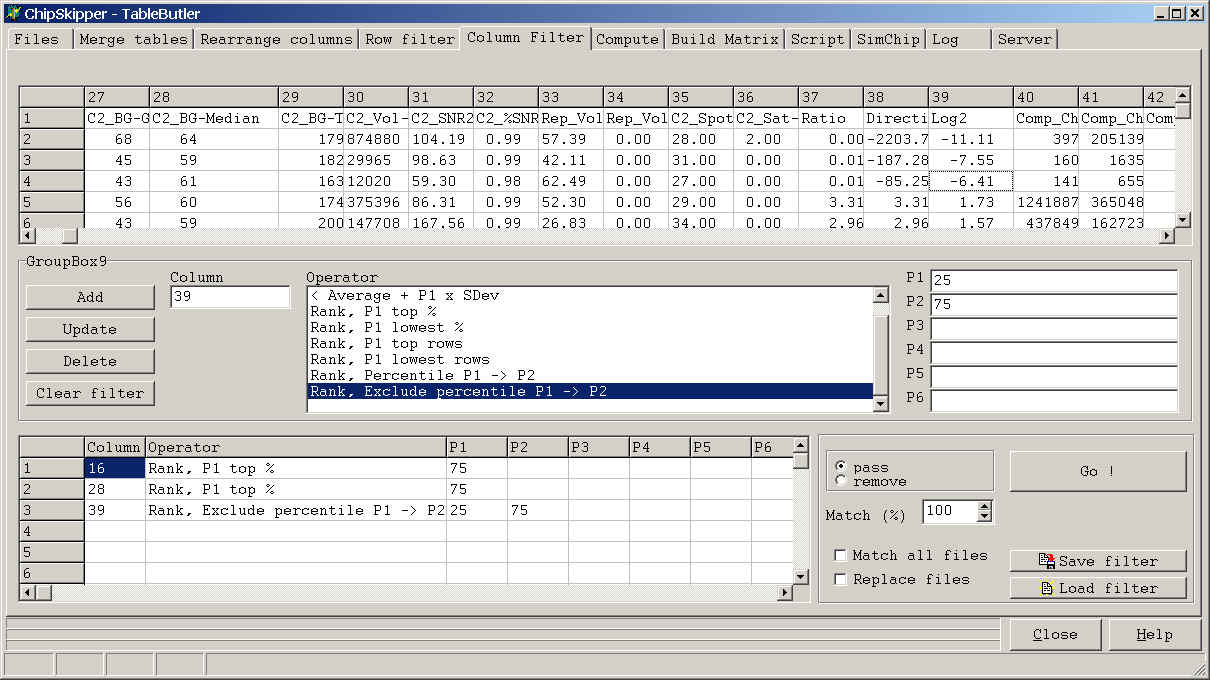
Click a colum in the preview grid, then click the Column field to define the filter column.
Select the Operator and set the corresponding parameters in the P1..P6 fields.
Add filter to the list of filters and run filter.
A defined filter may contain multiple operations and may be saved for later use.
The examples shows filtering of ChipSkipper data file :
1. Spot should belong to the 75% brightest spots in Red color channel
2. Spot should belong to the 75% brightest spots in Green color channel
3. Spot should be part of the 25% spots with lowest regulation or be part of the
25% spots with highest regulation.
Last edited 25.02.2004,