Data filtering : Row filter
This function allows to filter data on values derived from single rows.
Many image analysis programs produce quality estimates (e.g. Pass, Marginal,
Absent like in Affimetrix data).
Furthermore, a filtering strategy might be to filter data with a minimum
fluorescent intensity or a minimum expression ratio value.
TableButler's rowfiler allows to perform this task
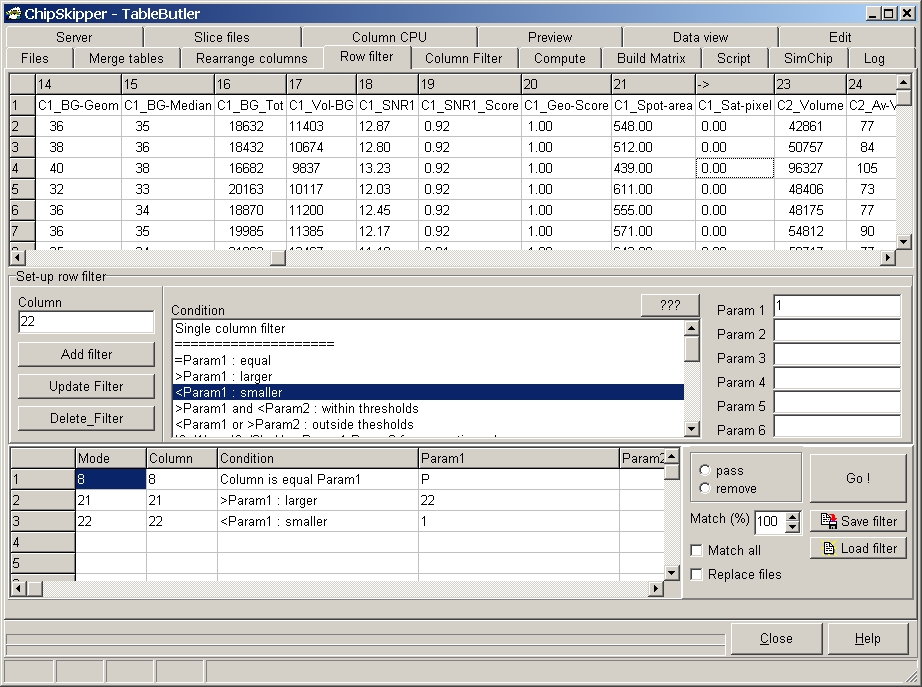
- Select the column on which the filtering shall pe performed (e.g.
C1_Sat_pixel to filter spots on the number of saturated pixel per spot) and
click the Column edit field.
- Select the filter from the Condition list box
- Enter required filter parameters in the corresponding respective edit
fields Param1..Param6
- Click the Add filter button to the filter list
- Click the Go button to run the filter(s)
TableButler shows a preview of the data file:
Filters :
- Contains query Text
- Equal query Text
- Empty
Numeric :
- Equal constant (e.g. value=100)
- Larger constant (e.g. value > 100)
- Smaller constant (e.g. value < 100)
- Between two constants (e.g.100 < value < 200 )
- Outside two constant (e.g. value < 100 or value > 200 )
- Abs Col1 >= Abs Col2 ( e.g. |-2| >= |1|, e.g. filte gene vectors
from expression matrices where SDev < | Average ratio | )
All column filter:
Filtering is applied to multiple columns. Postive filter events are
counted. Those rows where a defined percantage of positive event s occurred are
filtered, e.g. filter rows where 20% of all genes have ratio > 2.
- Col >= Constant in xx% cases
- Col >= Constant in xx% cases
- |Col| >= Constant in xx% cases
Filter on derived values:
- Spread > Constant, i.e. Max-Min value larger a given constant
- Mean > Constant, i.e. the average from all columns is larger a
given value
- |Mean| > Constant, i.e. the abolute value from average from all
columns is larger a given value (i.e. filler all gene vectors where average
ratio larger 2 or smaller -2)
- SDev > Constant, i.e. Standard deviation is above given value
- |Mean| / SDev > Constant, i.e. filter all genes vectors where Mean
ratio, given in units of standard deviation, is above a given value.
Add filter to the list of filters and run filter.
A defined filter may contain multiple operations and may be saved for later
use.
Select pass to place the positive rows into the output file, or
remove to skip the positive rows.
Click Match all to pass/remove the postive lines from all selected
source file.
Click Replace files to overwrite the source data files.
In the above example a ChipSkipper
data file is filtered.
1. Spot should conatin P=Pass flag, i.e. spots which have good Signal / Noise
score
2. Spot should have minimum area of 22
3. Spot should not contain saturated pixels.
Last edited 10.06.2005,