SUMO - Scatterplot viewer
A Scatterplot is a generic plot or mathematical diagram using Cartesian
coordinates to display values for typically two variables for a set of data.
The data is displayed as a collection of points, each having the value of one variable determining the
position on the horizontal (x-)axis and the value of the other variable determining the position on the vertical (y-)axis.
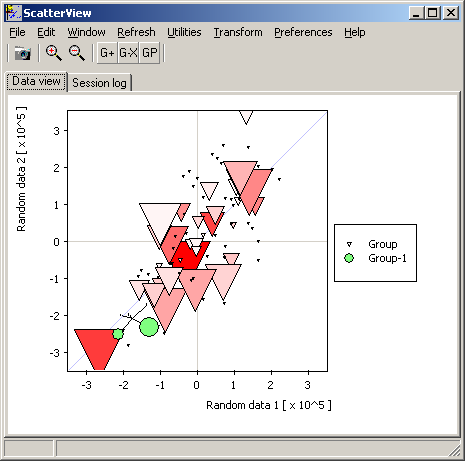
Additional values may be displyed as color and/or size of the respective data point's symbol, as well as error in x and y dimension.
If the size of the symbol is used in the graph is kind of a "Bubble chart".
Highly dens data may be shown as density maps.
You may select subgroups of data points dragging selction regions with mouse or search data point on their annotation or values.
Several different groups may be defined and visualied by customizable symbols/colors/symbol sizes.
You may also show names of selected/grouped data points.
Transform you scatterplot (i.e. the loaded data) to quantile or Volcano plot.
Graphs may be copied to clipboard or saved as BMP-pixle or SVG-/WMF-vector image files.
Vector graphs may be edited e.g. with InkScape.
Originally, Scatterplot-Viewer is called from SUMO's Data/Heatmap viewer to cmopare pairwise gene expression data.
But you may run the viewer stand alonne (SUMO main menu | Utilities | Scatterplot) and open/import tab delimited data files or copy/paste data from clipboard,
to compare pairwise numerical from any origin.
To open Scatterplot automatically when starting SUMO, create a link to SUMO and edit the "target line" to
"sumo.exe /scatterplot"
Scatterplot viewer is part of the SUMO package.