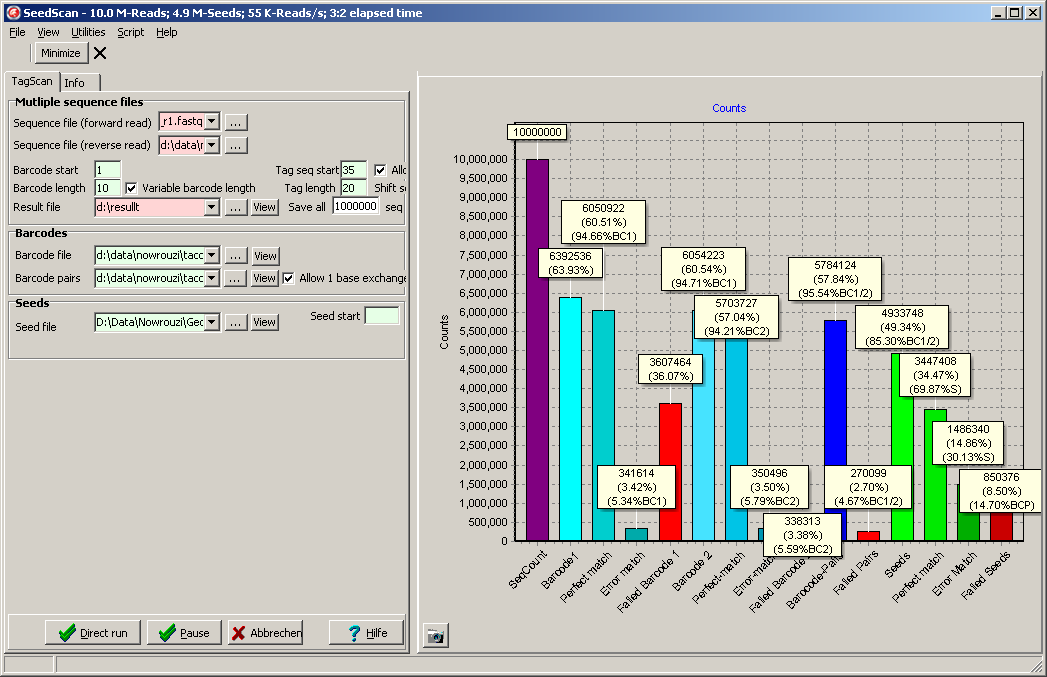
- Failed-BC1: A text file with the first ~1000 sequence pairs where no valid Barcode-1 was detected.
("basefilename_Failed_BC1.txt")
:
Odd lines contain the sequence number in the fastg-files (here reads 6,7,8,11)
Even lines contain the forward and reverse read for the this sequeence pair.
>S-6
GNTAGTGATAATGTCTTGTGGAAAGGACGAAACACCGCCCTCGGGTAGGGATACACAGTTTTAGAGCTAGAAATAGCAAGTTAAAATAAGGCTAGTACGTT          GATTCGACTCACTTCTACTATTCTTTCCCCTGCACTGTACCCCCCAATCCCCCCTTTTCTTTTAAAATTGTGGATGAATACTGCCATTTTTCTCAAGATAT
>S-7
TNAGAAACGGCAGAAGTGCCAGCCTGCAACGTACCTTCAAGAAGTCCTTTACCAGCTTTAGCCATAGCACCAGAAACAAAACTAGGGACGGCCTCATCAGG          TTACCGCTACTAAATGCCGCGGATTGGTTTCGCTGAATCAGGTTATTAAAGAGATTATTTGTCTCCAGCCACTTAAGTGAGGTGATTTATGTTTGGTGCTA
>S-8
TNCTGATGAGTTCTTGTGGAAAGGACGAAACACCGACTCAATCCGTGAGGATTGGTGTTTTAGAGCTAGAAATAGCAAGTTAAAATAAGGCTAGTCCGTTA          TACAGAGATCGTCTACTATTCTTTCCCCTGCACTGTACCCCCCAATCCCCCCTTTTCTTTTAAAATTGTGGATGAATACTGCCATTTGTCTCAAGATCTAG
>S-11
TNGCACCAAACATAAATCACCTCACTTAAGTGGCTGGAGACAAATAATCTCTTTAATAACCTGATTCAGCGAAACCAATCCGCGGCATTTAGTAGCGGTAA          CAACGCCGCTAATCAGGTTGTTTCTGTTGGTGCTGATATTGCTTTTGATGCCGACCCTAAATTTTTTGCCTGTTTGGTTCGCTTTGAGTCTTCTTCGGTTC
- Failed-BC2: A text file with the sequence pairs where a valid Barcode-1 was detected, but no listed Barcode-2
("basefilename_Failed_BC2.txt")
Odd lines contain the sequence number in the fastq-files (here reads 129,216,231,445)
and the identified Barcode ID and sequence.
Even lines contain the forward and reverse read for the this sequence pair.
>S-129; BC1=GNTCGATATCTGTAGAC
GNTCGATATCTGTAGACTCTTGTGGAAAGGACGAAACACCGACCAGGCAAATATGTTGGAGGTTTTAGAGCTAGAAATAGCAAGTTAAAATAAGGCTAGTC          AAACAAACACTCACACAAAAAAAATAATTACCCATCCAATTTACCCCCCAAACCCCCCTTTAATTTTAAAATTGTGAATAATAAATCCCATTTTAAAAAAA
>S-216; BC1=GNTCGATTCTGACGTCA
GNTCGATTCTGACGTCATCTTGTGGAAAGGACGAAACACCGAGAACATGAAGTGCGCCTCGGTTTTAGAGCTAGAAATAGCAAGTTAAAATAAGGCTAGTC          ATCATACTGCTCTCTACTATTCTTTCCCCTGCACTGTACCCCCCAATCCCCCCTTTTCTTTTAAAATTGTGGATGAATACTGCCATTTGTCTCAAGATCTA
>S-231; BC1=ANTATGCTAGTA
ANTATGCTAGTATCTTGTGGAAAGGACGAAACACCGAGCTATCGGAAAGTCAAGAGGTTTTAGAGCTAGAAATAGCAAGTTAAAATAAGGCTAGTCCGTTA          ATACGACTCAGTAATACTATTCTTTCCCATCCACTTTACCCCCCAATCCCCCCTTTTCTTTTAAAATTGTGTATGAATAATGCAATTTTTATCAAAAAATA
>S-445; BC1=TNTACTGCACT
TNTACTGCACTTCTTGTGGAAAGGACGAAACACCGCTGCAGCAGTCGGTGACTCTGTTTTAGAGCTAGAAATAGCAAGTTAAAATAAGGCTAGTCCGTTAT          TACAATCATCTACTAATAATAATTACCCTTCAATTTAACCCCCAAACCCCCCATTTCATTTAAAAATTTGGAATAAAACATCCATTTGTCTCAAGAAAAAG
- Failed-BCPairs: A text file with sequence pairs where Barcode-1 as well as Barcode-2 were within the defined list, but pairing is not "allowed", i.e.not in the Bacode-Pairs list file.
("basefilename_Failed_BCPairs.txt")
Odd lines contain the sequence number in the fastq-files (here reads 32,110,117,211)
and the identified Barcode 1/2 IDs.
Even lines contain the forward and reverse read for the this sequence pair.
>S-32; BC1=19;BC2=49
CNATTAGTGTAGATTCTTGTGGAAAGGACGAAACACCGTGCAAAGAACTCATATGAGGGTTTTAGAGCTAGAAATAGCAAGTTAAAATAAGGCTAGTCCGT          ATCGATTACACGTGATTCTACTATTCTTTCCCCTGCACTGTACCCCCCAATCCCCCCTTTTCTTTTAAAATTGTGGATGAATACTGCCATTTGTCTCAATA
>S-110; BC1=28;BC2=63
CNATACGCGAGTATTCTTGTGGAAAGGACGAAACACCGTTTGTTGCTAAACGGTATTGGTTTTAGAGCTAGAAATAGCAAGTTAAAATAAGGCTAGTCCAT          TCGATTCGCACTAGTTCTACTATTCTTTCCCCTGCACTGTACCCCCCAATCCCCCCTTTTCTTTTAAAATTGTGGATGAATACTGCCATTTGTCTCAAGAT
>S-117; BC1=17;BC2=40
ANTATGCTAGTATCTTGTGGAAAGGACGAAACACCGTCGGCTGGGCCAAAGGAACGGTTTTAGAGCTAGAAATAGCAAGTTAAAATAAGGCTAGTCCGTTA          ATCGATCGTCTATGTCTCTACTATTCTTTCCCCTGCACTGTACCCCCCAATCCCCCCTTTTATTTTAAAATTGTGGATGAATACTGCCATTTATCTAAAGA
>S-211; BC1=30;BC2=56
ANCGATAGACGCACTCTCTTGTGGAAAGGACGAAACACCGAGAACATTAAGTGCGCCTCGGTTTTAGAGCTAGAAATAGCAAGTTAAAATAAGGCTAGTCC          GAGCGATTCTATACTATTCTACTATTCTTTCCCCTGCACTGTACCCCCCAATCCCCCCTTTTCTTTTAAAATTGTGGATGAATACTGCCATTTGTCTCAAG
- Matched seeds: A text file with sequence pairs where everything matched.
Barcode 1/2, valid pair, correct seed sequnece idntified.
For Clone tracer: Index primer found, seed sequences do not exist.
("basefilename_Matched_Reads.txt")
Odd lines contain the sequence number in the fastq-files (here reads 1,2,3,4)
and the identified Barcode 1/2 ID, Pair-ID, ID of matched seed, ID of LIbrary.
Even lines contain the forward and reverse read for the this sequence pair.
>S-1; BC1=15;BC2=49;SeedID=32571;LibID=1
ANCGATTACGTCATCATCTTGTGGAAAGGACGAAACACCGACTCCACCCAAACATCTGGTGTTTTAGAGCTAGAAATAGCAAGTTAAAATAAGGCTAGTCC          ATCGATTACACGTGATTCTACTATTCTTTCCCCTGCACTGTACCCCCCAATCCCCCCTTTTCTTTTAAAATTGTGGATGAATACTGCCATTTGTCTCAAGA
>S-2; BC1=14;BC2=48;SeedID=47980;LibID=1
TNGATACTGTACAGTTCTTGTGGAAAGGACGAAACACCGACCTAGCCAGTGATGGACCAGTTTTAGAGCTAGAAATAGCAAGTTAAAATAAGGCTAGTCCG          TCGATTCTAGCGACTTCTACTATTCTTTCCCCTGCACTGTACCCCCCAATCCCCCCTTTTCTTTTAAAATTGTGGATGAATACTGCCATTTGTCTCAAGAT
>S-3; BC1=25;BC2=59;SeedID=71798;LibID=1
TNGAGTCAGTATCTTGTGGAAAGGACGAAACACCGGCTCGTCATATTGCATAAGAGTTTTAGAGCTAGAAATAGCAAGTTAAAATAAGGCTAGTCCGTTAT          TCGTGTCTCTATCTACTATTCTTTCCCCTGCACTGTACCCCCCAATCCCCCCTTTTCTTTTAAAATTGTGGATGAATACTGCCATTTGTCTCAAGATCTAG
>S-4; BC1=7;BC2=41;SeedID=51296;LibID=1
GNTCGATATCTGTAGACTCTTGTGGAAAGGACGAAACACCGCTGCAGTGGAACTATTGGAAGTTTTAGAGCTAGAAATAGCAAGTTAAAATAAGGCTAGTC          GATCGATCACGCACAGATCTACTATTCTTTCCCCTGCACTGTACCCCCCAATCCCCCCTTTTCTTTTAAAATTGTGGATGAATACTGCCATTTGTCTCAAG