Filter data
Depending of source and quality of data it
might de recommended to filter, count and remove data rows (genes) which do not full fill
certain minimum numerical requirements.
E.g. samples which contain too many non-numerical or to many very low intensity values.
It might be recommended not to compute statiscal paramaeers from such very biased data rows.
=> remove such data rows from the datset
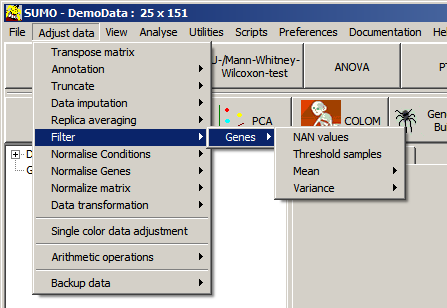
Select Main menu | Adjust data | Filter:
NAN values = Not A Number:
Some programs return as expression ratios NAN
when signals are close to zero ( e.g. red / green => 10 / 0 = nan), or in
case negative ratios shall be converted to log 2 (e.g. log2 (red / green )
=> log2 ( 12 / -3) = nan.
SUMO automatically converts NAN values => 0. But for data where there are
many NAN values found this may introduce a BIAS to the data.
Therefore, you can filter away those genes where a too large part of the
expression values consists of NAN.
Select Main menu | Adjust data | Filter |
Genes | NAN values. The group selection dialog pops-up:
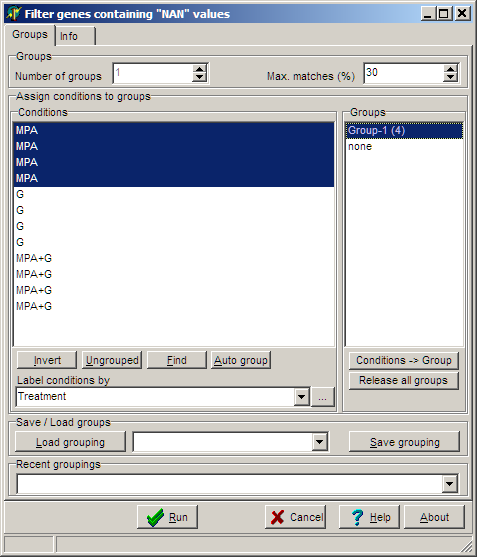
As
described, you can select certain sub-sets of hybridisation and assign to
the group which will be used for filtering of data.
In the above example we have three treatments.
To assure, that not more then one value per group and gene is undefined we first
filter all "MPA" hybs, then the "G" hybs and finally the "MPA+G" hybs.
The value of allowed NANs in the selected group is set with the Max.Matches
(%) edit field (in the example set to 30 which means one NAN-value is
allowed.
Click the Run button to filter. A dialog
reports the result:
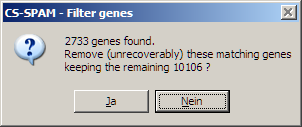
In the example 2733 genes were found with more >1 NANs.
Click Yes to remove these genes. This
filtering option can not be redone (of course the original data matrix was not
changed and may be reloaded).
To keep the filtered matrix save it under a new name.
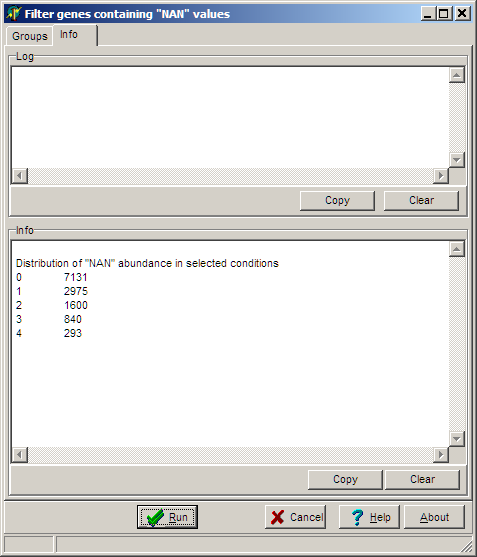
To see some details of the NAN distribution view the Info tab-sheet:
Threshold samples
Similar method to NAN filter.
Define a Threshold and a hit level (in percent).
SUMO counts percentage of selected samples where the data value is below/larger the defined threshold.
Samples with higer hit rate are removed.
Enter Percentage and thresold (divided by ",") into the Threshold field:
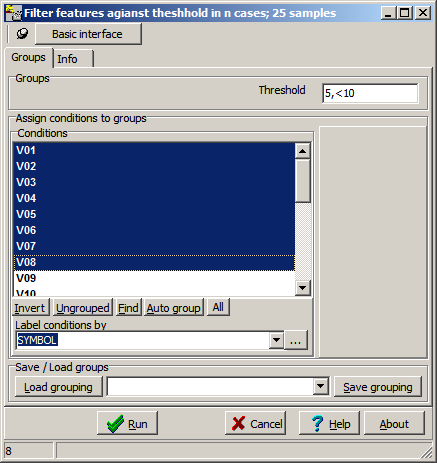
- The first parameter defienes the ratio (in percent)
- Second parameter the thresold.
- "5,<10 ":
Remove all genes where more then 5% of all samples have a numerical value smaller 10.
- "10,=0 ":
Remove all genes where more then 10% of all selected samples have a numerical value identical to "0".
Filtering may be performed with the whole sample set or a freely defineable sub set of the samples.
Mean
Similar method like the above filter.
This time, we compute an average (Arithmetic or Median mean) from all selected conditions for each individual condition.
Define a threshold and whether larger/smaller features shall be filtered.
E.g. ">100":
All features where average from all selected conditions is laerger 100 will be filtered.
Filtering may be performed with the whole sample set or a freely defineable sub set of the samples.
Variance
Pattern searching methods (e.g. Clustering, PCA, NMF, ...) require differences between conditions / condiotn gruops.
Features which are uniform can not contribute to such pattersn, but form a hindering ballast for
information extraction and consume cpu time and memory.
For such applications, it may be helpful to remove features with low variability in the data.
Similar method like the above filter.
This time, we compute variance from all selected conditions for each individual condition.
Define a threshold and whether larger/smaller features shall be filtered.
Variance may be computed as:
- Standard Gaussian distributian based variance
- MAD = Median absolute deviation
To compensate for varying signal levels it might be preferable to filter on z-transformed data
(performed on the flight only for variance filering) or to use Coefficient of Variation.
E.g. ">1":
All features where variance from all selected conditions is larger 100 will be filtered.
Filtering may be performed with the whole sample set or a freely defineable sub set of the samples.