K-means / -medians Clustering
K-Means Clustering is a iterative distance based
clustering method. In opposite to totally non-supervised hierarchical
clustering, k-means clustering requires one key parameter: K, the number of clusters
to search for.
The goal is to divide the objects (genes in the expression matrix) into a user
defined number of K clusters in such a way that all members of the cluster have
the same common pattern, different to all other clusters.
The user has to define the number of clusters K
for which the algorithm shall try to build cluster.
Often the number of clusters may be guessed according to a hypothesis. But in
most cases it is hard to determine the correct number of clusters, even on well known problems:
Define number of clusters for playing cards
- Red / Black => 2 clusters
- Spades,Hearts,Clubs,Diamonds => 4 clusters
- ...
Not depending of the internal structure of the
data, K-means clustering will always try to dissect the data into the requested
number of k clusters. Independent of the real internal data structure.
When asking for
- a too high k, redundant clusters may be created,
- too small k of clusters, sub-classes may be lost
One way to solve this dilemma may be Sihouettes.
Basic algorithm:
- Define number of clusters (k) to search for
- Distrance metric
- Method to compute centroids (mean/median)
Initialize the cluster centroids with random values
Iterate:
- Compute distance of each feature to all cluster centroids
- Assign features to cluster with smallest feature-centroid distance
- Recompute new centroifs from all member features<
-
- if STOP criterion is reached - finalize
otherwise continue with step one.
The overall computational burden is proportional the the number of featues (Ord(n)m and thus much faster compared to hierarchical clustering (Ord2).
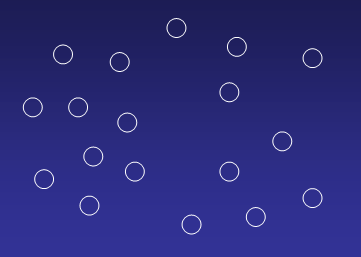
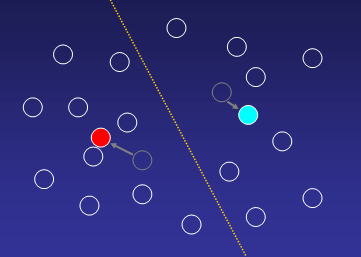
Imagine a dataset which shall be divided into two clusters:
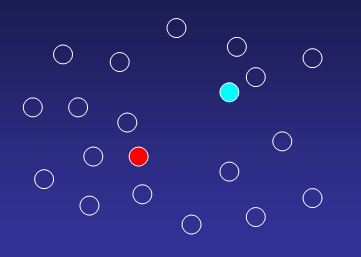
Randomly assign centroids to the two clusters:
1. Compute distances from each gene to all cluster
centroids, and assigne a gene to that cluster where distance to centroid is
minimal:
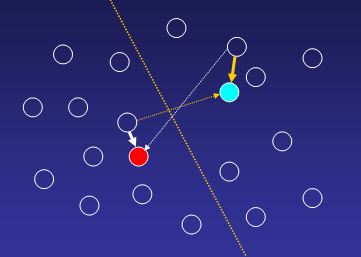
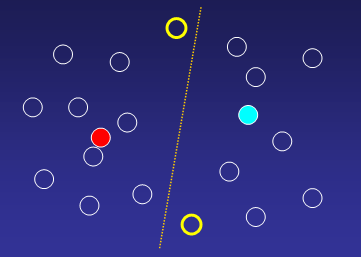
Until all genes are uniquely assign to one of the k-clusters:
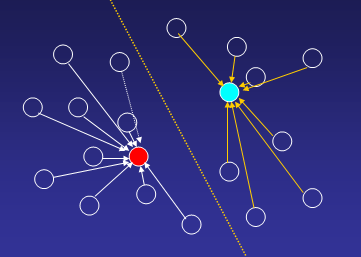
2. Re-compute cluster centroids with new cluster members:
 3. Reassign genes to new cluster centroids
Parameters
Having selected KMC by clicking the KMC-button ( or
from Main menu | Analyse | KMC), the Group Selection / Parameter dialog pops
up.
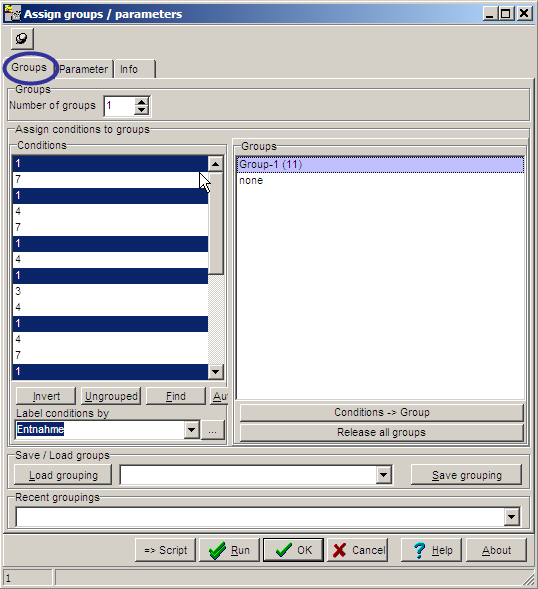
ON the Groups tabsheet,
the hybridisations used for a KMC analyses may be selected:
On the Parameters tab sheet, basic computation
parameters may be set:
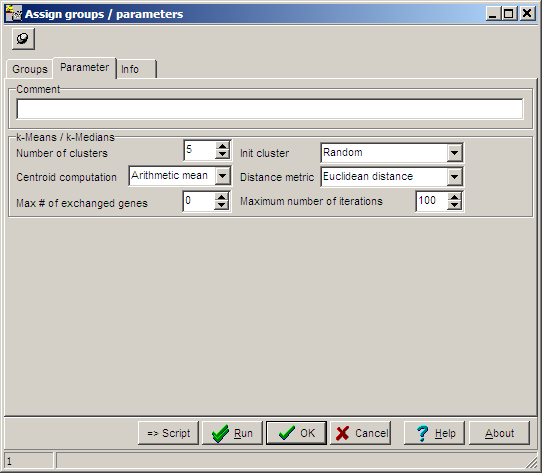
| Number of clusters |
K, the cluster number, default value=5 |
| Init cluster |
Method how to initialize cluster centroids:
- Random, random values taken from the dat amtrix (hot deck) are assign to the centroids
- Regular "wave" patterns scaled to date in the matrix |
| Centroid computation |
The method how to compute cluster centroids from member genes:
- Arithmetic mean
- Median |
| Distance metric |
The method how to compute Centroid <=> feature:
- Euclidean distances
- Correlation distance
Same as used as for hierarchical clustering.
|
| Stop criterion |
Stop criterion1:
- Count number of featureds exchanged between the clusters during one iteration.
As soon as this number is small enough, KMC stops.
|
| Maximum number of iterations |
Stop criterion 2:
Maximumn number of iterations "Assign genes/Re-compute centroids".
Useful in cases where KMC does not converge: i.e. there is no
preferable gene=>cluster assignment. |
Data views
After the analyses a new branch is added to the Analysis tree:
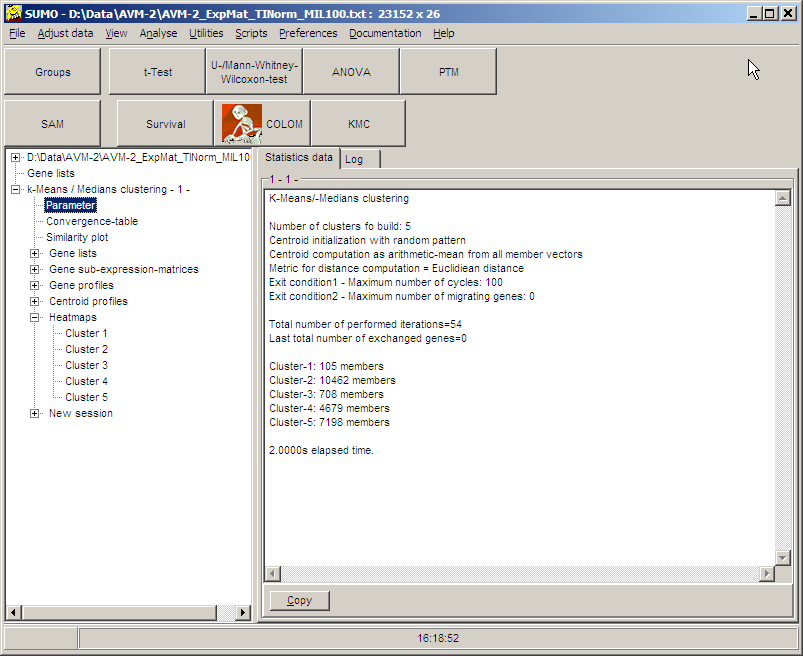
As usual, Gene lists, Sub-expression-matrices, Gene-/Centroid
profiles or heat maps for the respective cluster may be
displayed, by clicking the respective tree item.
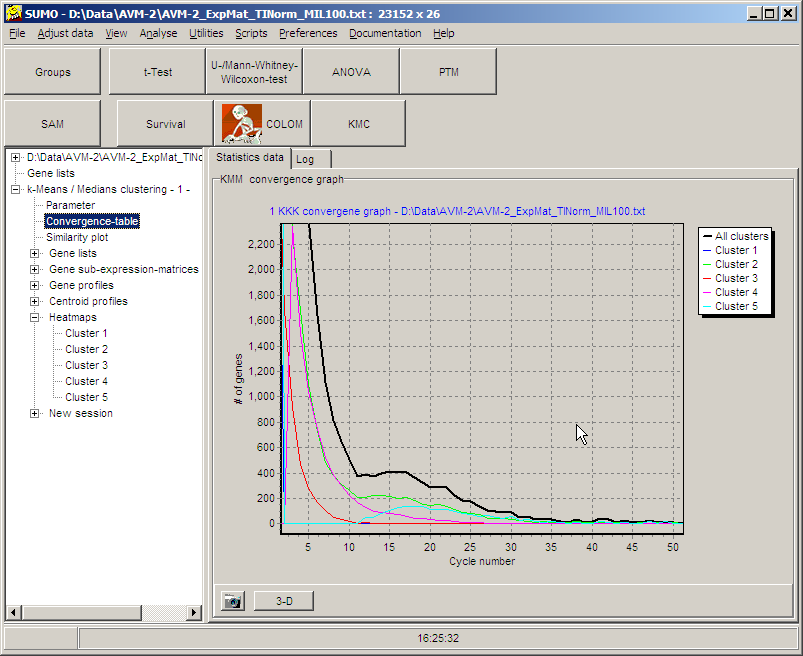
Convergence table:
The convergence table displays graphically how fast
each single cluster as well as the whole KMC-analyses converges to its
final classification:
One way to estimate clustering success might be to anlyse distances of featúrs beeing members of a cluster (INTRA cluster distance ~ Signals) versus distances of features from differnt clusters (BETWEEN clsuster distances ~nopise).
Wikpedia explans:
Silhouette refers to a method of interpretation and validation of consistency within clusters of data.
It was proposed by Belgian statistician Peter Rousseeuw in 1987.
The silhouette value is a measure of how similar an object is to its own cluster (cohesion) compared to other clusters (separation). The silhouette ranges from -1 to +1, where a high value indicates that the object is well matched to its own cluster and poorly matched to neighboring clusters. If most objects have a high value, then the clustering configuration is appropriate. If many points have a low or negative value, then the clustering configuration may have too many or too few clusters.
The silhouette can be calculated with any distance metric, such as the Euclidean distance or the Manhattan distance.
The method in brief:
For each feature Fi (gene) a Silhouette score is computed.
WITHIN cluster distance ai is computed, as average from all distances between feature Fi to features forming the SAME cluster to which Fi belongs.
BETWEEN cluster distance bi is computed, as average from all distances between feature Fi to features beloning to all other clusters.
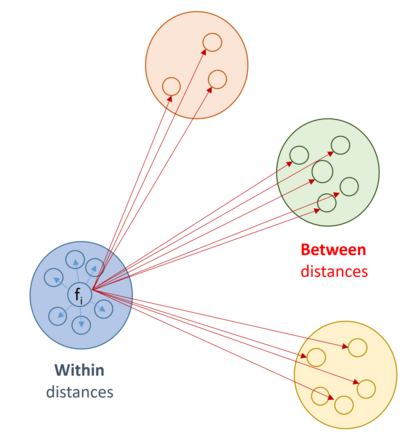
The Silhouette score is the normalized difference between BETWEEN and WITHIN average distances:
si = ( bi-ai ) / max(ai,bi)
It indicates whether Fi fits nicely to its cluster ( si ~1 ), could fit to anywhere ( si ~1 ), or doesn't belong at all to its cluster ( si ~ -1 ).
Next an average from Silhouette scores from all features of a cluster is derived, indcating how tightly members af a cluster are matched
(very well ~1, very bad ~ -1).
Finally the Silhouette Coefficient (SC) is computed as Maximum from all Cluster-Silhouette-Score-Averages.
A high SC indicates that the clustering is able to reflect the real structure in the data.
Whereas a small SC indicates there are too few - or too many - cluster generated by e.g. k-Means.
with ohter words the nmuber of k was not optimal selected.
Thus we can run multiple k-means clusterings with increasing k (eg. k=2,k=3, .... k=10), and compute the corresponding SC.
The k at which SC becomes maximal suggest the best clustering (dependant on the other clustering parameters, e.g. distance metrc, ...).
Nevertheless, if the best SC is <<1, clustering is probably meanngless.
Analysis progres is show in the Log tab sheet:
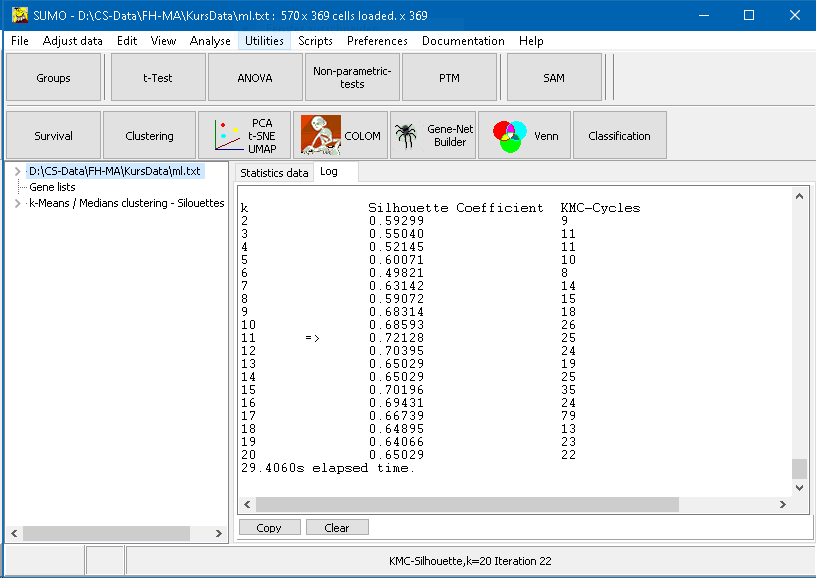
The final table summarizes:
- column - k - number of clusters
- column - Silhouette Coefficient
- column - number of KMC cycles to reach stable clustering
The highest Silhouette Coefficinet is found at k=11, suggesting 11 clusters as the most suited k value, with selected distance metric, initialization, mean computation, ...
There are alternative suggestions how to compute cluster validity indices.
Calinski-Harabasz index
This index is computed as:
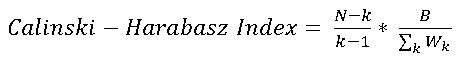
With: N= number of features (genes), k=number of clusters, B=between cluster distance, Wk=within distance for cluster k
As samller the index as better the clustering.
Dunn index
Dunn-Index = (Minimum Cluster-Cluster-Centroid distance) / Maximum (Feature-Feature distances)
As larger the Dunn-Index as better the claustering.
Davies-Bouldin Index
For each Cluster i we find the maximum seaparation Di to any other cluster j, i,j=1..k,i≠j as
Di = max (Intra-Cluster-Distancei + Intra-Cluster-Distancej) / Between-Cluster-Distance i,j
Davies-Bouldin-Index = Average ( Di)