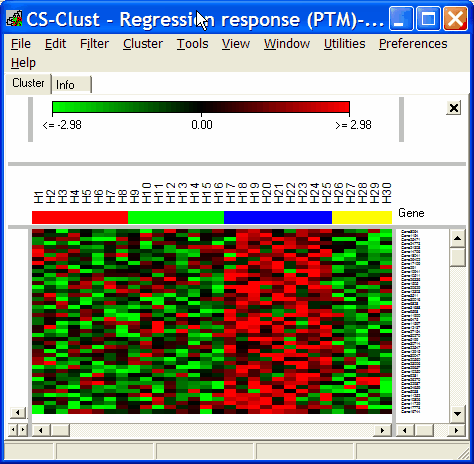
See Analysis of strain and regional variation in gene expression in mouse brain for details.
Assume you have a synchronised cell culture, i.e. all cells are in the same state of the cell cycle.
Let the cells grow, take aliquots at regular time intervals and perform expression profiling from all samples.
If you are interested in those genes which are activated in G2-phase, you could define a template profile:
- not expressed in G1,S phase
- activated in G2-phase
- not expressed M phase
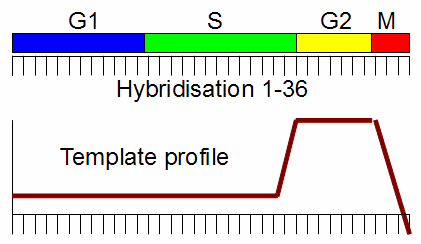
Now you can compare each single gene's expresion profile with the template profile, by computing a correlation coefficient between each single gene's expression vector with the predefined template vector.
SUMO returns a correlation coeffcient between -1 and 1:
- 1 : identical pattern between the gene and the template - that what you are looking for
- 0 : no similarity at all - don't care
- -1 : perfect inverse pattern between gene and template - the antagonists, may be interesting, too
How to define a template pattern:
- Interactively define the pattern manually: Use a template pattern editor to manually define the template pattern
- Select a gene (or the centroid from multiple genes) from you experiment as template
- Use numeric data in your hybridisation annotation as template (e.g. find genes which are expressed in correlation with the volume of grown tumors).
Template matching with SUMO
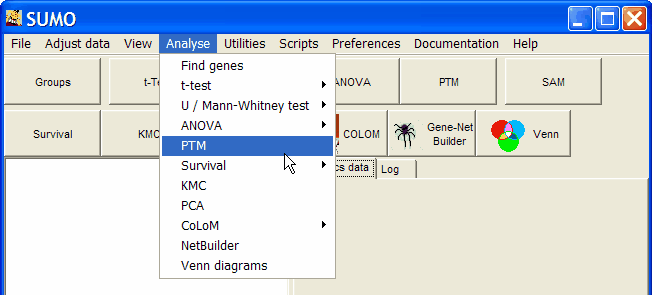
Click PTM button or select Main menu | Analyses | PTM
SUMO's group selector opens up:
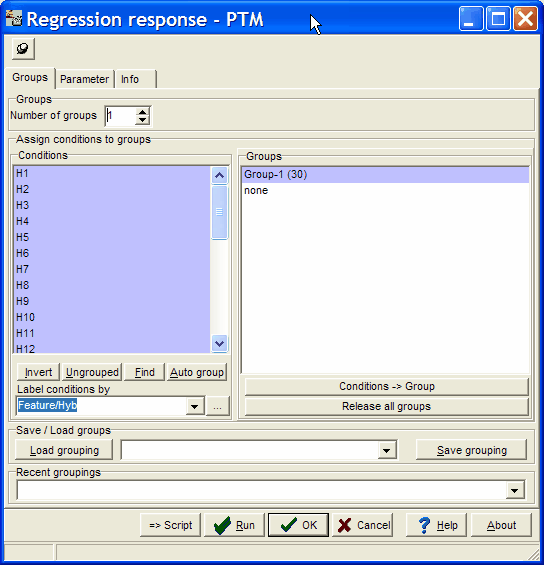
By default, all hybridisations are assigned to group one, and thus used for template matching.
But you can select a subset of your hybridisations and use them for an analysis.
You may also define multiple groups (e.g. G1,S,G2,M from the example above).
These groups are lateron visualised in template editor and result heatmaps.
After hybridisation selection, got to the Parameters tab
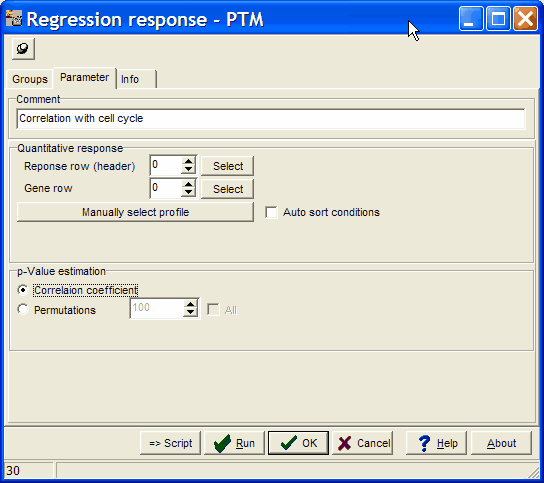
Give the analysis a name in the Comment field.
Select Correlation coefficient (or Permutations) to select how correlations are weighted.
Define the template pattern for matching:
Click the Manually select profile button.
The template profile editor opens up:
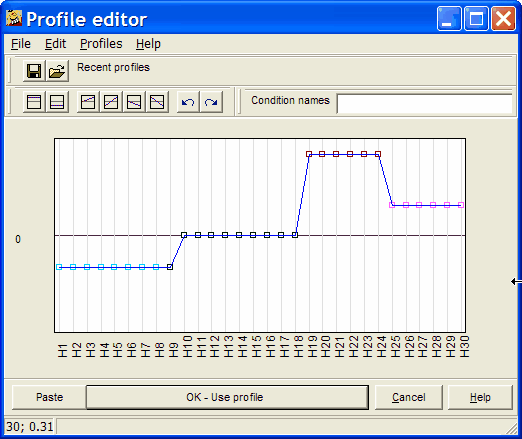
Now you can freely edit the profile.
See more details about profile editor.
Gene template:
Use a gene from the loaded expression matrix as template.
In case you know the the line number of the gene in the loaded expresion matrix, you may type it into the Gene row field.
Click the Select gene row button. The extended Profile editor opens-up:
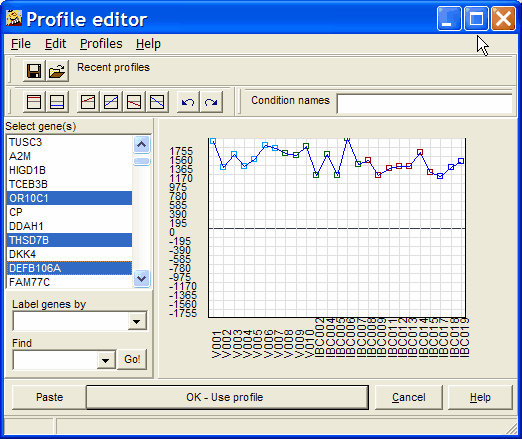
Select a single (or multiple with Ctrl+mouse click) genes. The selected gene (or the centroid = average gene vector from all selected genes) will be used as template.
Still, you may manually edit the selected and preset profile.
Numeric data in hybridisation annotations as template
Use hybridisations information as correlation template.
In case you know the the line number of the hybridisation annotation in the expresion matrix, you may type it into the Response row (header) field.
Click the Select Response row (header) button. The extended Profile editor opens-up:
In the example, survival data from cancer patients (included in the expression matrix) are selected to search genes, where gene expression would correlate with survival time.
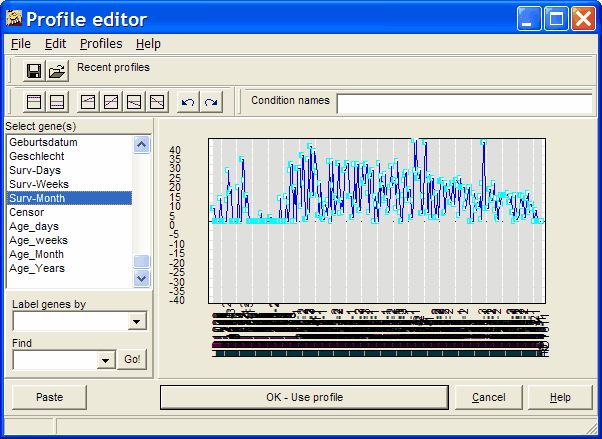
Select a single hybridisation annotation. Obviously, you should only select numerical annotation values. The selected annotation vector will be used as template.
Still, you may manually edit the selected and preset profile.
Finally click the Run button to perform the analysis.
A new entry is added to the analysis tree:
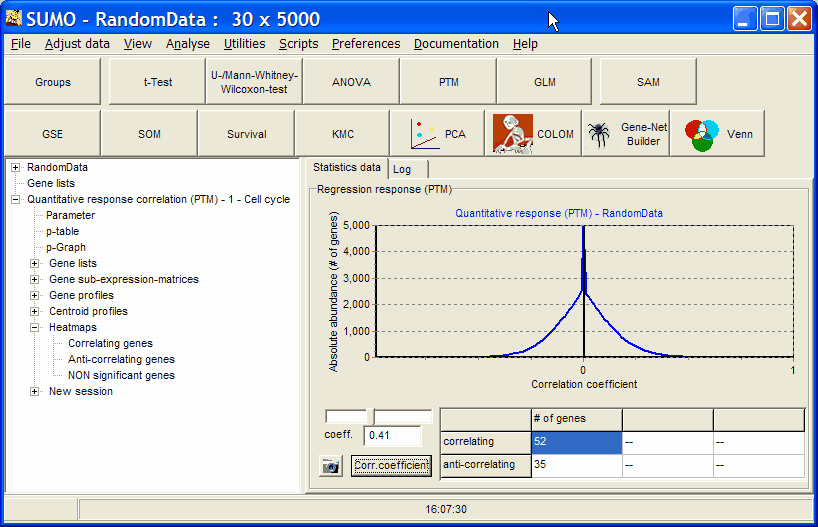
To view the number of genes in respect to correlation coefficient select p-Graph from the analysis tree.
Use the slider to adjust the correlation coefficient and watch in the data table how number of correlating and anti-correlating genes are changing.
Select Heatmaps | Correlating genes to e.g. view a heatmap of the correlating genes at correlation coefficient >=0.41 in the example ( not a good correlation coefficient):
