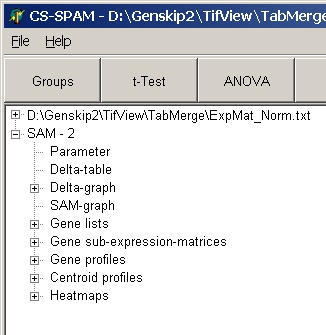
SAM - Analysis tree
SAN analysis generates Delta values and lists of statistically significant
and non-significant genes.Tto view these data you will find a series of nodes in
the the Analysis tree:
Parameter:
View parameters used for this particular SAM analysis:
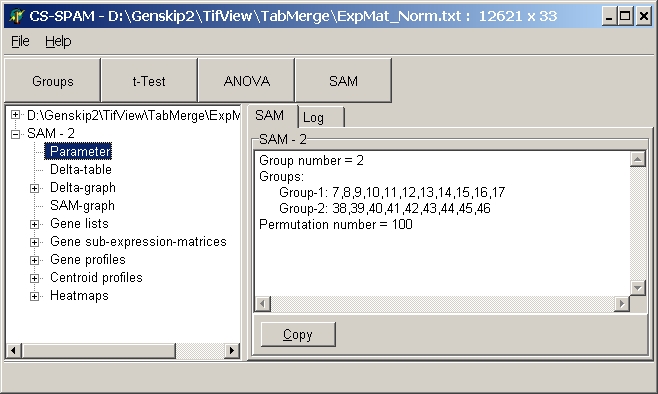
Click the Copy button to copy the
displayed parameters into Clipboard.
Delta table
Show numbers of significant / non-significant genes depending on Delta
value:
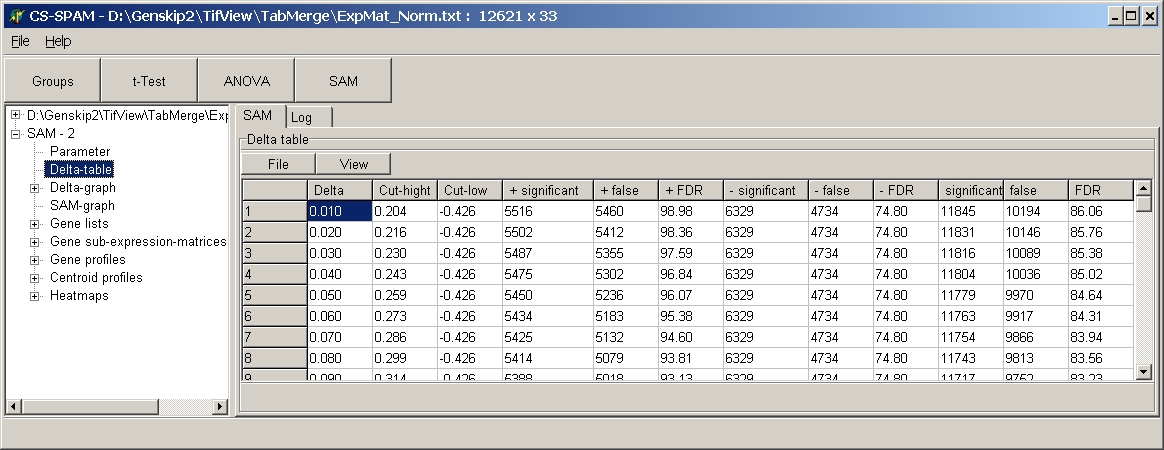
SUMO calculates for each Delta value between 0 and 10 with
increment 0.01 SAM statistics and summarizes the results in the Delta table:
- Delta = Delta value
- Cut-high : Dexperimental where Dexperimental
- Dpermutation > Delta
- Cut-low : Dexperimental where Dpermutation
- Dexperimental > Delta
- + significant = number of up-regulated significant genes
- + false = number of false significant up-regulated genes
- + FDR = false discovery rate for up-regulated genes
- - significant = number of down-regulated significant genes
- - false = number of false significant down-regulated genes
- - FDR = false discovery rate for down-regulated genes
- significant = number of regulated significant genes (= "+
significant" + "- significant")
- + false = number of false significant regulated genes
- + FDR = false discovery rate for regulated genes
To save the table selec File | Save as. For more
details how to work with data tables go here.
Delta graph
These graphs visualizes the values from the
Delta table as line graphs.
They can be used to roughly estimate a sufficient Delta value.
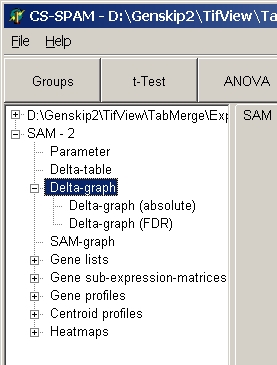
Delta graph absolute
This graph show abolute numbers of genes (y-axis) in
dependance of the Delta value (x-axis).
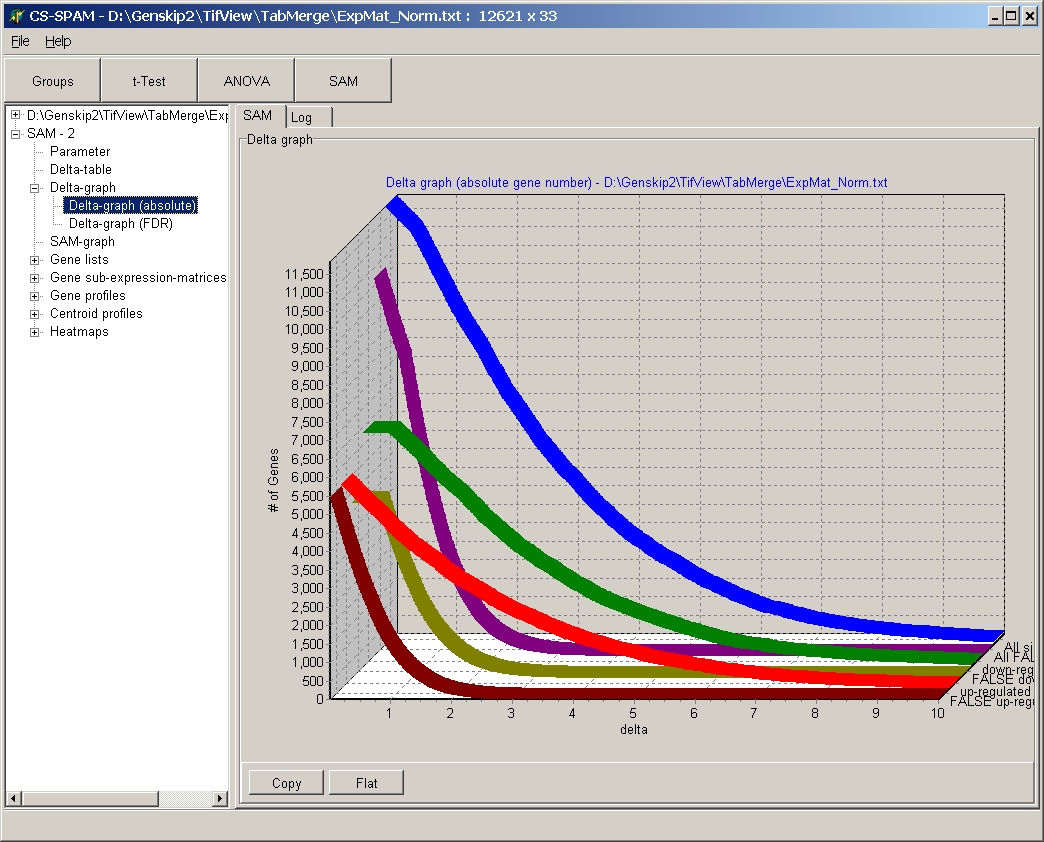
- Red line: significant = number of up-regulated significant genes
- Brown line: + false = number of false significant up-regulated genes
- Green line: significant = number of down-regulated significant genes
- Dark green line: - false = number of false significant down-regulated genes
- Blue line: significant
= number of regulated significant genes (= "+
significant" + "- significant")
- Purple line: non-significant
= number of false significant regulated genes
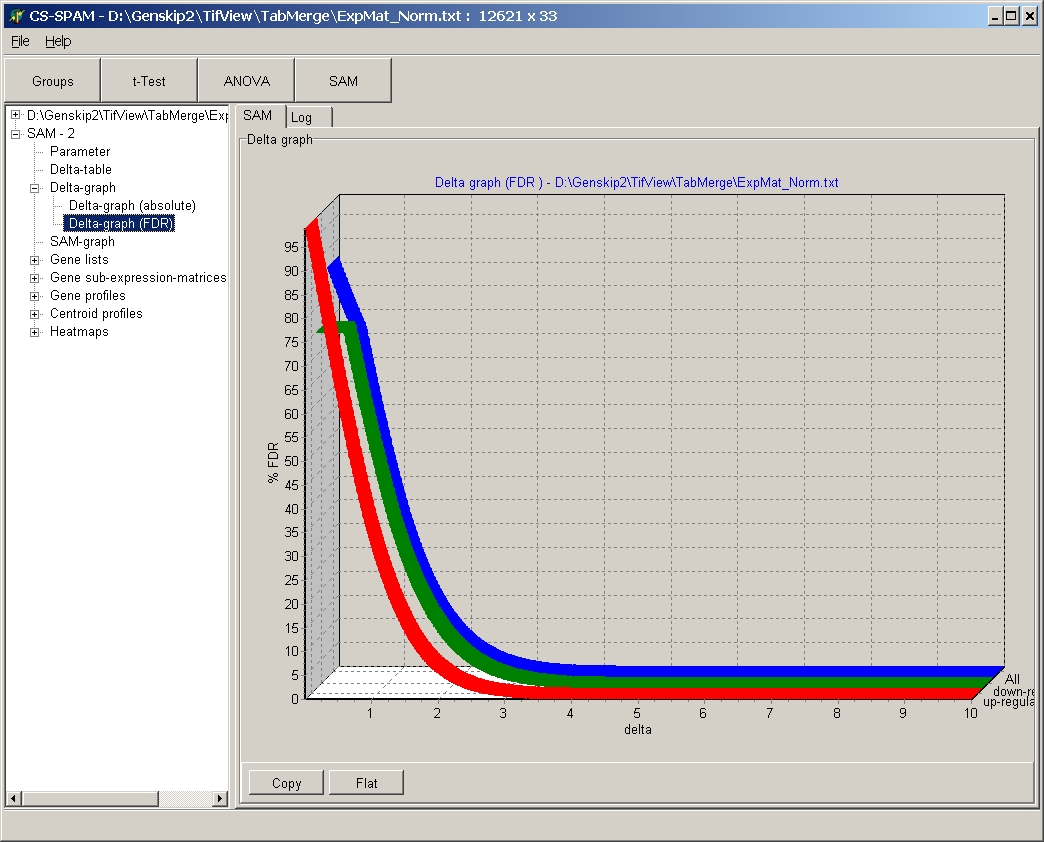
Delta graph relative
This graph shows FDR (y-axis) in dependance of the Delta
value (x-axis).
For more details how to work with data tables go
here.
SAM graph
The SAM graph visualizes the distribution of experimental
statistics ( Dexp ) versus permutaion statistics (Dperm
).
Therfore, both datasets are ranked (i.e. sorted) and siplayed as scatterplot.
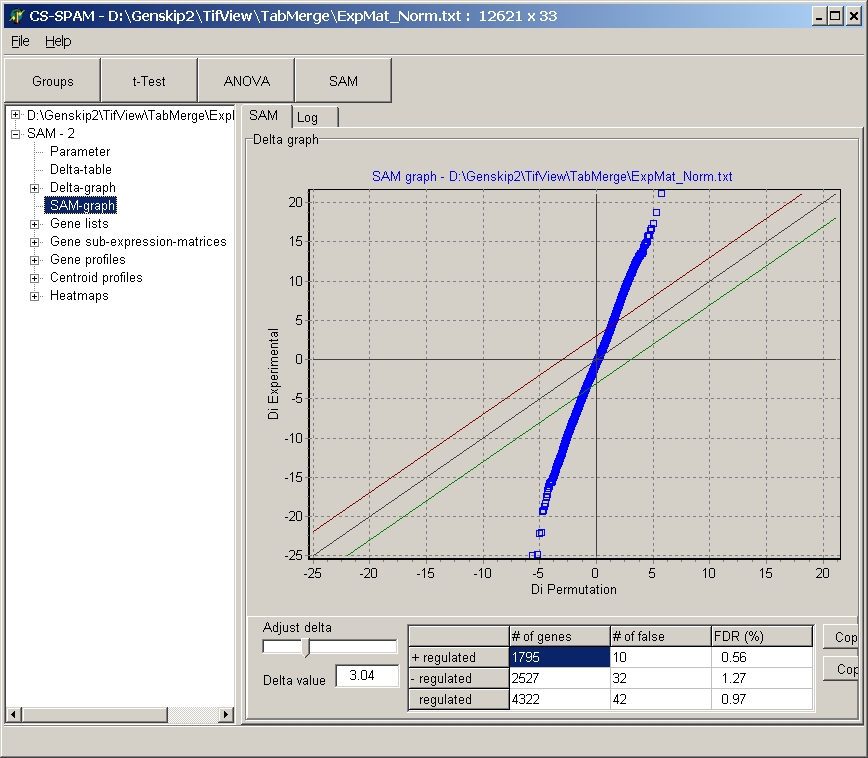
Elements of the graph:
- Main diagon (black line)
- Delta threshold lines (red for up-regulated genes,
green for downregulated genes).
- Blue squares represent all individual genes
Controls
- Delta slider: use the slider to adjust Delta value.
Present value is shown in Delta value edit field
- Delta edit field: type a nubmer for teh Delt value
Data table
show number for significant and non significant gens as
well as FDRs.
Use the Delta slider to adjust the delta value such, that
a desired FDR or number of singnificant / non-significant genes can be filtered:
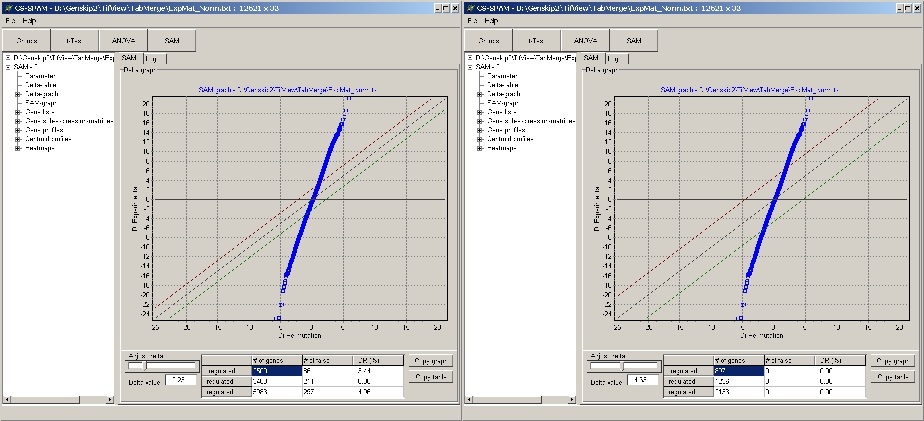
Example:
- Left panel: Delta set to have = = 0% FDR
- Right panel: Delta set to have ~ 5% FDR
Genelists, Gene
expression sub-matrices, Gene profiles,
Controid profiles and Heatmaps show Genes filtered
according to the present Delta settings.
Gene Lists
Get lists of significant / non-significant genes:
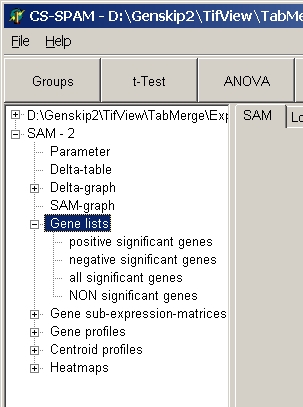
Click a subnode to view the respective list of genes:
- positive significant genes= significant up-regulated
genes
- negative significant genes= significant down-regulated
genes (only in single- and two-class SAM)
- all significant genes = positive + negative (only in
single- and two-class SAM)
- NON significant genes
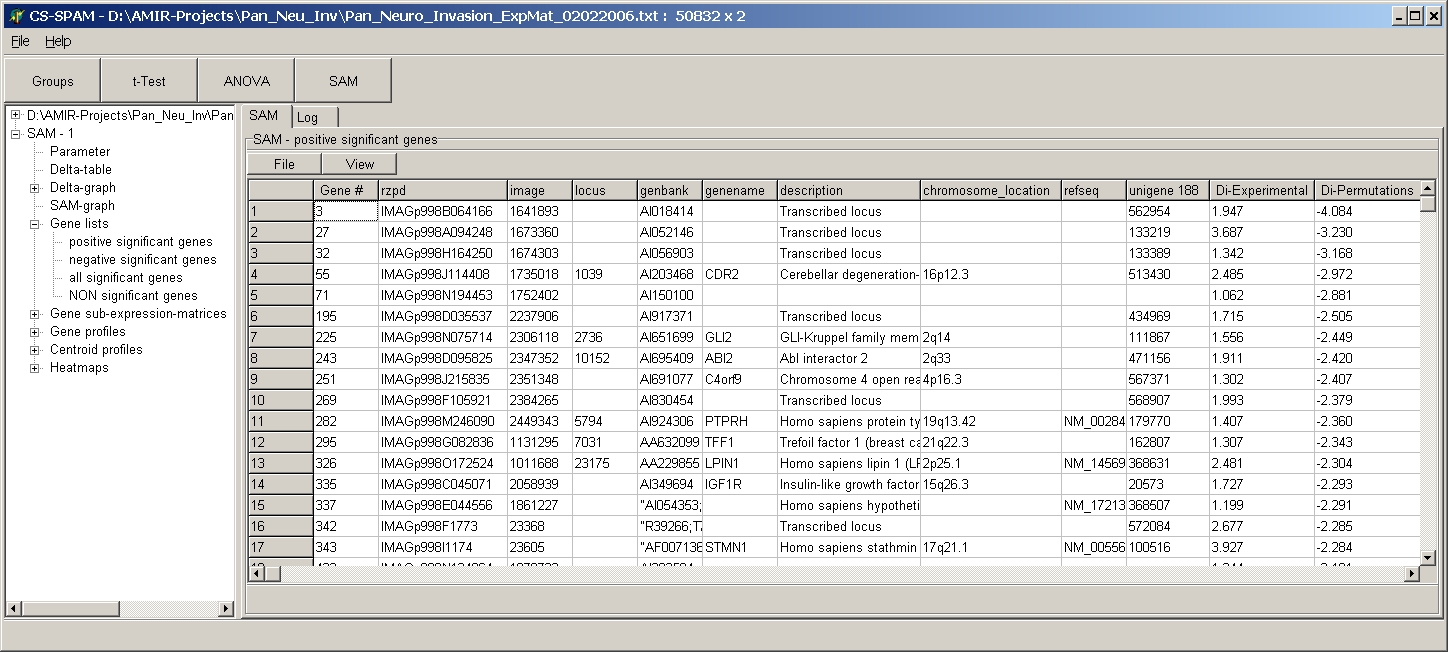
The table shows:
- Gene # = Original gene number is source expression
matrix
- All gene annotations as found in the original source
expression matrix
- Di-Experimental
- Di-Permutation
For more details how to work with data tables go
here.
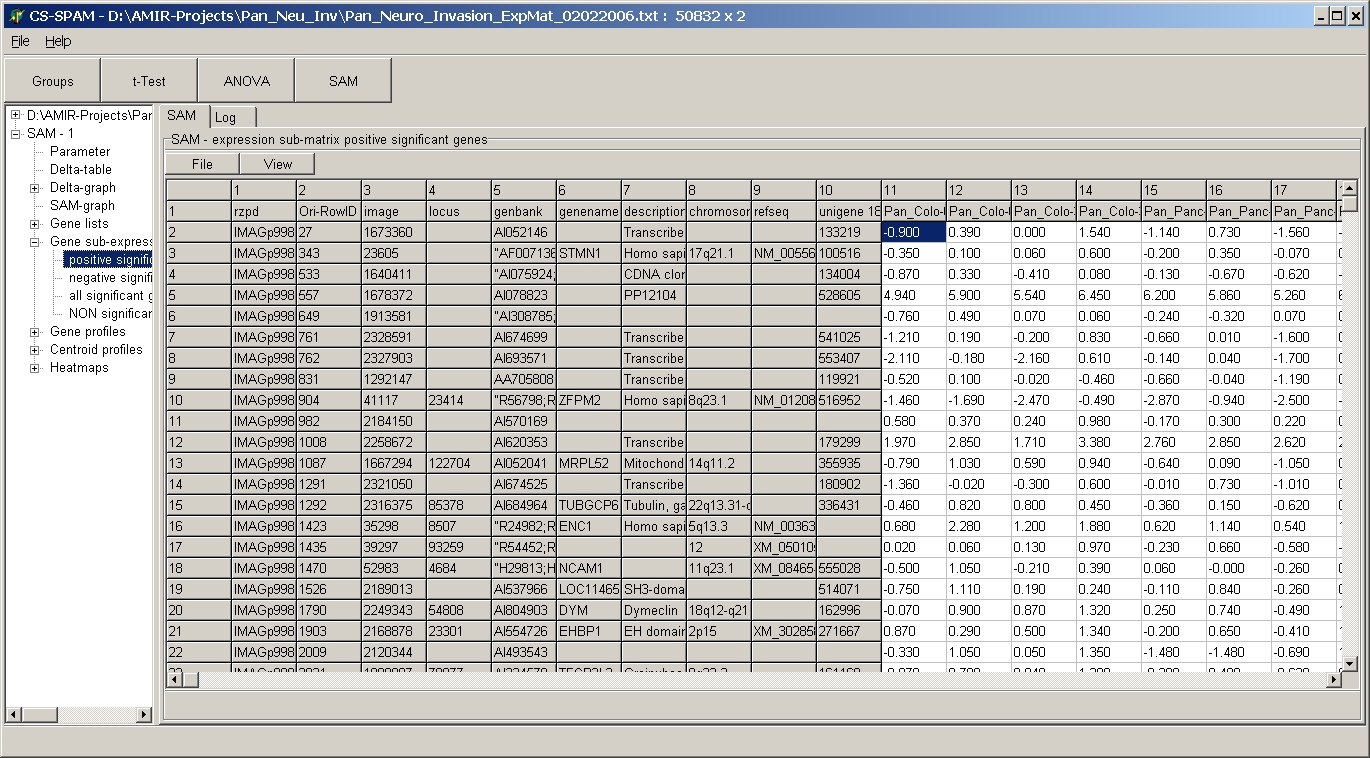
Gene expression sub-matrices
Get expression sub-matrix of respective genes with all
expression values for subsequent analysis.
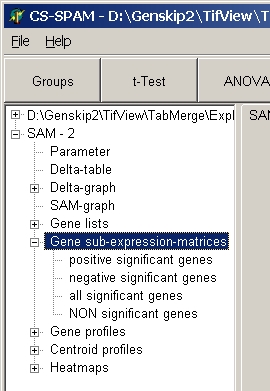
Click a subnode to view the respective sub-matrix :
- positive significant genes= significant up-regulated
genes
- negative significant genes= significant down-regulated
genes (only in single- and two-class SAM)
- all significant genes = positive + negative (only in
single- and two-class SAM)
- NON significant genes
Gene profiles
View expression profiles of the respective genes as line
graphs:
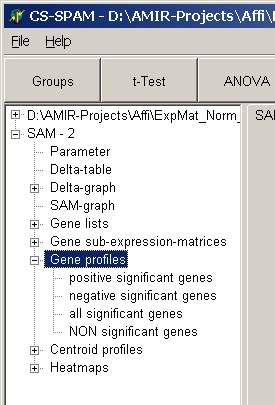
Click a subnode to view the respective gene's expression
profiles :
- positive significant genes= significant up-regulated
genes
- negative significant genes= significant down-regulated
genes (only in single- and two-class SAM)
- all significant genes = positive + negative (only in
single- and two-class SAM)
- NON significant genes
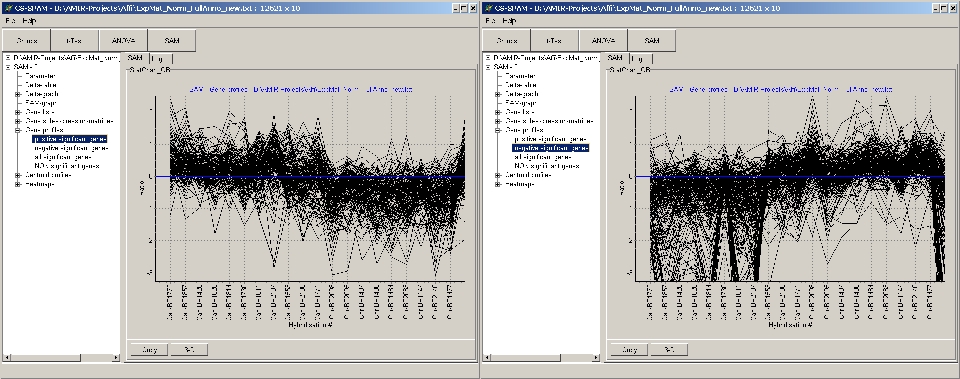
Example:
- Left panel: up-regulated significant genes
- Right panel: down-regulated significant genes
When thousands of genes are in a selection group (e.g. NON
significant genes), it may take a while to build the graph.
For more details how to work with data tables go here.
Centroid profiles
View averaged expression profile from all
respective genes:
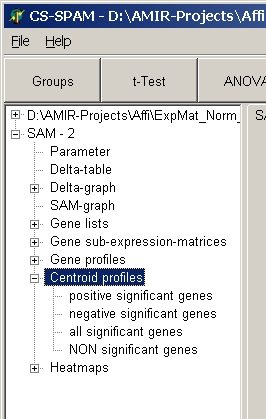
Click a subnode to view the averaged expression profiles
from all respective genes :
- positive significant genes= significant up-regulated
genes
- negative significant genes= significant down-regulated
genes (only in single- and two-class SAM)
- all significant genes = positive + negative (only in
single- and two-class SAM)
- NON significant genes
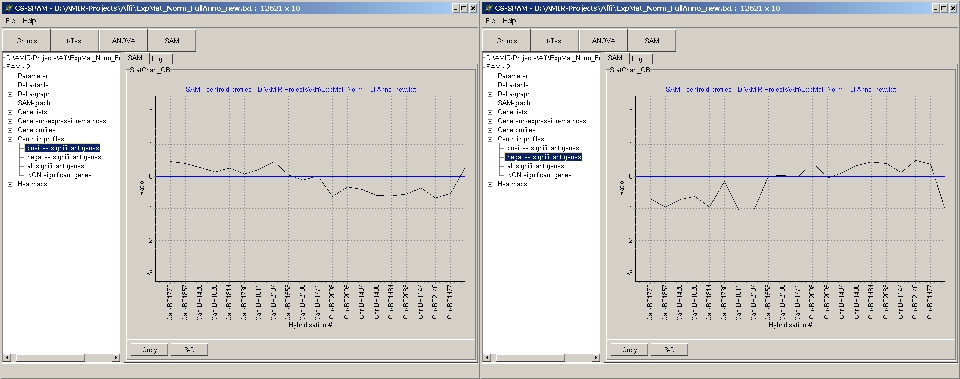
Example:
- Left panel: up-regulated significant genes
- Right panel: down-regulated significant genes
Heat maps
View expression profiles of the respective genes as
Heatmaps:
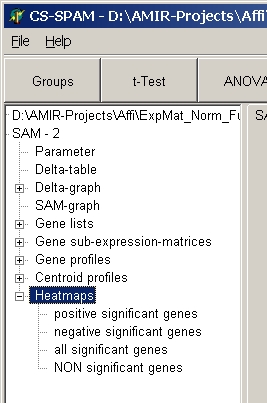
Click a subnode to view the respective sub-matrix as
hetmap:
- positive significant genes= significant up-regulated
genes
- negative significant genes= significant down-regulated
genes (only in single- and two-class SAM)
- all significant genes = positive + negative (only in
single- and two-class SAM)
- NON significant genes
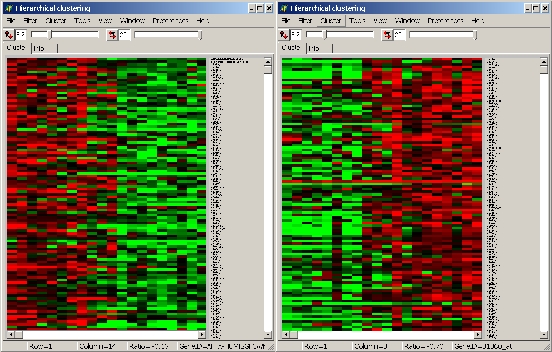
Example:
- Left panel: up-regulated significant genes
- Right panel: down-regulated significant genes
last edited 04.04.2006