SUMO - Utilities

Here you may find varous additional functions and utilities which do not logically fit into the overall programm structure:

Grubbs outlier removalA tool to remove outliers from data vector(s)
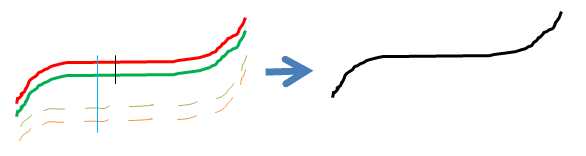
MethylationHere you can find various functions to preprocess/convert methylation data, derived from Ilumina 450K methylation microarrays.


Outlier removal

Imagine, you wish to compute the average from a data vector, which might contain irregular measured values:

12,13,11,10234,14,16,12,15

Arithmetic mean = 1290.875

Which is completetly wrong, due to the one outliying value (10234).

One method to circumvent this problem could be to use a "robust" mean estimator:
Median, Truncated mean, Winsorized mean, Tukey biweight, ....

But all these methods require to define a portion of potentially outlying values.
If this estimate is incorrect, you might remove "good" values, decreasing the power of your analysis. Alternatively, if you remove to few outliers your means might still be wrong.

Another method could be to iteratively remove extreme values which might not belong to the main data cloud:
Grubbs' test for outliers.
In brief:
Iteratively compute:
Thus outlier removal is dynamically adopted to the size of your data set, signal to noise ratio, value of outliers.

In SUMO select Utilities | Grubbs outlier removal.

A spread sheet like dialog opens up:
Paste you data vector (or multiliple lines) of tab delimited data into the sheet.

Now you can remove outlying data from Rows / Columns by clicking the respective button.
SUMO will ignore and skip non numeric / empty data cells.
SUMO removes "outliers" from the remaing data within each single row / column.
Finally you may copy rows/columns, or save the complete table as tab-delimited text file.

In the result tab-sheet, SUMO will list the number of removed values for each row / column.


Methylation

Here you can find various functions to preprocess/convert methylation data, derived from
Ilumina 450K methylation microarrays.


Extract Quants from IDat

Original Illumina IDAT files are saved as undocumented binary data files.
For analysis outside Illumina GenomeStudio, instensity data (or others) have to be extracted.
SUMO wraps the "readIDat" function from
illuminaio R-package, and extracts the measured intensities ("idat$quants").

Select:
SUMO Main menu | Utilities | Methylation | Extract Quants from IDat

A file selection dialog opens up.
Select all IDat files that shall be processed.

SUMO uses the script:
      library(illuminaio)
idat <- readIDAT("filename.idata")
write.table (idat$Quants,"filename.idat.txt",sep="\t")

For each IDat file a text files is created in the folder from which the IDat file was read.
The generated text files contain for each feature:
Build an expression matrix from the individual *.txt files (e.g. with SUMO | File | Import | Buld matrix ....)

Requirements:


M/U impute missing intensity values

When working with raw intensities (one columns for methylated / one for un-mehtylated intensity data), Non numeric-/Zero- values may cause problems in later processing.

Thus, SUMO can analyse independantly Mehtylated / unmethylated data and impute row averages for data cells, where cell value is below a user deined threshold.

Only requirement: data columns are organized pairwise: one sample mehtlyted/un-methylatd (or inverted pair-order).


Pairwise color quantile normalization


A well known problem may occur from unequal labeling efficiencies with the two different dyes.
One way to circumvent ths problem, might be to perform quantile normalization for all intensities coming from one single samples (two hybs).
For this procedure we encounter the problem of the the two Illumina design types which have differernt numbers of probe sets.

Similar to:
Analyze Illumina Inhiium methylation microarray data
Pan Du, Gang Feng, Spencer Huang, Warren A. Kibbe, Simon Lin,
October 13, 2014


SUMO tries to circumvent this problem, by ranking all four data subsets (two colors / two designtypes) independantly, and scaling the two smaller data subsets to the larger ones:


Averages for the quantiles are now computed from all four feature values, or from only two feature values, where there were no data mapped from the smaller data subsets:


M/U Intensities => M or Beta


Convert pairwise intensity values into M / Beta (=ratio values).
M = Methylated-intensity / Un-methylated-intensity      
Comparison of Beta-value and M-value methods for quantifying methylation levels by microarray analysis
Pan Du1, Xiao Zhang, Chiang-Ching Huang, Nadereh Jafari, Warren A Kibbe1, Lifang Hou Simon M Lin
BMC Bioinformatics 2010, 11:587

Beta = Un-methylated-intensity / Methylated-intensity
SUMO asks for column order: In the rare case where very small intensities have been measured in both color channels, artificial, misleading extreme ratios are generated (e.g. 1/2 or 4/1).
To circumvent this problem a small user defined additive constant (alpha)may be set (e.g. "100", => 101/102 or 104/101).
Default value = 100 (~typical background value for Illumina background intensities):
On typical high intenity values for positive measurement, the small offset is neglegible (e.g. 10000/5000 => 10100/5100).


M/U Intensities => Total intensity


Illumina 450k methylation arrays measure abundance of methylation sites spread accross the whole genome in high resolution.
Sum of Methylated and Un-methylated probe intensities represent abundance of the genomic region for the specific site.
Thus one can "misuse" methylation data for Copy Number Variation analysis (CNV).


Convert Beta => M


Just convert Beta values to M (=direct ratios).
Instead of using raw Methylated/Un-methylated intensity values for computing of M (log2 ratio M/U), one can convert the values:

     M = log2( Beta / (1-Beta) )

Obviously, this conversion can not reflect a correction for small intensity values ("alpha" see above).


Convert M => Beta


Just convert M values to Beta .
Instead of using raw Methylated/Un-methylated intensity values for computing of Beta ( = M/(U+M+alpha) ), one can convert the values:

     Beta = 2M / (2M+1) )

Obviously, this conversion can not reflect a correction for small intensity values ("alpha" see above).


Methylation - BMIQ normalization

Illumina 450K Methylation arrays contain two different probe types.
The two probe types underly different DNA methylation distributions and dynamic range, which may introduce biases into downstream analysis.

"BMIQ is an intra-sample normalisation procedure, adjusting for the bias in type-2 probe values, using a 3-step procedure published in Teschendorff AE et al "A Beta-Mixture Quantile Normalisation method for correcting probe design bias in Illumina Infinium 450k DNA methylation data", Bioinformatics 2012 Nov 21."
For more details see:
A beta-mixture quantile normalization method for correcting probe design bias in Illumina Infinium 450 k DNA methylation data.
Teschendorff AE1, Marabita F, Lechner M, Bartlett T, Tegner J, Gomez-Cabrero D, Beck S.
Bioinformatics. 2013 Jan 15;29(2):189-96. doi: 10.1093/bioinformatics/bts680. Epub 2012 Nov 21.

SUMO wraps the the BMIQ_1.3 R-script to perform BMIQ normalisation.
The code SUMO uses can be seen here.

In SUMO, load an expression matrix containing:
Remove any non numeric values (e.g. impute missing values).
Ensure data range is from 0 to 1.
In SUMO select:

Main menu | Utilities | Methylation | BMIQ-normalisation

A column selection dialog opens up.
Select the "gene" annotation column which contains the Illumina design type.
The annotations column should contain either " I " for design type 1 or " II " for design type 2 (of course one entry for each single feature.

A parameter dialog opens up:

Check and adjust parameters accordingly.
For more details about meaning and suggested parameter values see the publication about BMIQ.
SUMO will spawn the BMIQ script for each sample in the loaded matrix, and place the normalized values into the matrix.
When normalization has finished, don't forget to save data under a new name.

BMIQ normalisation is a time consuming complex process.
One sample will require around 60s on an Intel I7-2.5GHz CPU.
At any time press ESC key. SUMO will stop as soon as the running sample is finalized.
NB: Now you have a mixed data matrix: already processed samples as well as still original data.

SUMO tries to detect, problems and informs when the R-script did not finalize as expected.
After transformation, check plausability of data.

In case data seem to look scrambled, check the intermidiate data files.
In your local windows temp directory you can find:

SUMO_BMIQ_r_result.txtLog file from R, showing any potentially problems/exceptions during execution of BMIQ R-script.
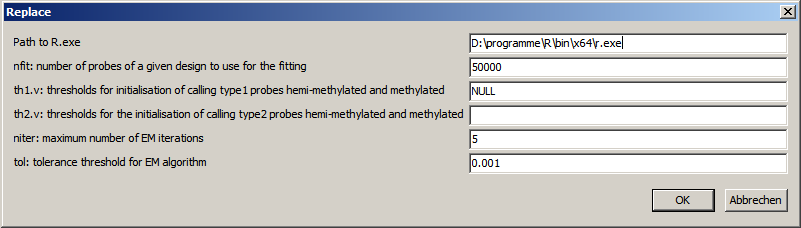
SUMO_BMIQ_r_input.txtThe data set exported by SUMO as nput for the R-script.
The file should cntain two columns:
type=Ilumna designtype (1 or 2)
data=beta values (0 to 1)
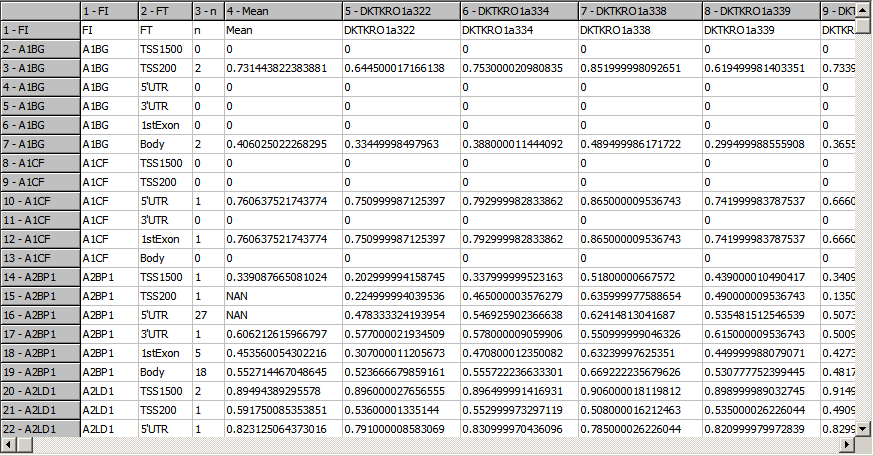
SUMO_BMIQ_r_data.txtData created by the R-script, re importes by SUMO into the expression atrix.
one data column containing the transformed Beta values (0 to 1)
SUMO_BMIQ_r_output.txtOther computational results generated by the Rscript, here the "quality" for the iterative Beta-fits
SUMO_BMIQ_r_script.txtThe R-script generated by SUMO.

Requirements:


Feature averages

Illumina methylation microarrays supply multiple probes per gene, which are grouped in functional regions:
- TSS1500
- TSS200
- 5'UTR
- 3'UTR
- 1st Exon
- Body

For further analysis it may be recommended to compute an average methylaton for the functional group - or even the complete gene.

Select Main menu | Utilities | Methylation | Feature averages.

In the parameter dialog define:
- Colum number where "gene1:region1;gene2:region2;" information is given
- Row number which contains the sample ID to be shown in the result file
- Averaging method
- Result file name

SUMO will analyze the loaded data set:
- Search all unique gene names
- Index all original data rows, to the unique gene names
- for each gene, extract all values for all six (see above) functional regions for each sample
- compute a mean estimate for each region and sample
- save data to a tab-delimited result file:

The file contains:
- First rows: sample annotations just copied from original data file
- First column: Gene name as extracted from gene:region column as defined above
- Second column: Gene region as extracted from gene:region column defined above
- Third column: Number of features for this particular gene:region
- Fifth column: Arithmetic average from all samples for this gene_region
- following columns: Average from all feature for the respective gene:region/sample computed as above

The method my be applied to Beta, M or CNV values.


Resamplng test

The resampling test is a variant of a class test with permutation statistics.

In the resampling test, we leave the assignment of samples to the defined classes, but generate random subsamples of the original assignment.

Thus we mainly test the stability of our hypotheses when using various subsets of the groups.

SUMO may perform the resampling according to several schemes:

Group balanced resampling

Samples are straight resampled from the defined groups.

Assume a 2-class test with 10 samples each:
- Group-1: a1,a2,a3,a4,a5,a6,a7,a8,a9,a10
- Group-2: b1,b2,b3,b4,b5,b6,b7,b8,b9,b10

Now we run 100 permutations, with 80% of the samples.

SUMO generates 100 randomly generated subsets consisting of 8 randomly seleted samples from each group:
Permutation-001: a1,a3,a4,a5,a7,a8,a9,a10 - b2,b3,b4,b5,b6,b7,b8,b10
Permutation-002: a1,a2,a3,a5,a7,a8,a9,a10 - b1,b2,b4,b5,b7,b8,b9,b10
Permutation-003: a2,a3,a4,a5,a6,a7,a9,a10 - b1,b3,b4,b5,b6,b8,b9,b10
...
Permutation-100: a1,a2,a3,a4,a6,a7,a8,a10 - b1,b2,b3,b5,b7,b8,b9,b10


Stratified resampling

In case you want to take care, that certain sample conditions are isomorphic distributed in the permutation's groupings, you may select stratified resampling.
Select the Stratifiied option in the Resampling radio button group on the Paramter page of the group selection dialog.
Additionally select the corresponding condition annotation in the Label condtions by drop down list on the Select samples page of group selection dialog.

Assume you have a condition annotation which describes tumor Grading for all samples S1,S2,S3,...
E.g. S1:G1, S2:G1, S3:G0, S4:G45, S5:G0, S6:--, S7:G0, S8:G2, ....
CLick Stratified on the Parameters page.
Select the Grading description from the Label condition by list.

SUMO searches unique strata from the grading annotation.
From the above example we would find 5 strate: "--,G0,G1,G2,G45"
All permutations, are now build in such a way, that the fraction of the strata in the permutations is identical to the fractions of original starting configuration
.
In case you want to build a more complicated stratification (e.g. combine gender and smoking =>Male:Smoker, Male:NonSmoker, Female:Smoker, Female:NonSmoke), generate an additional condition annotation line with this stratification prior running the test.

Obviously, stratificiation may drastically reduce the number of unique permutations to be performed - in particular with jackknifing.
SUMO does not check for redundant permutations.

Resampling p-value:

For each of the permutatons, a p-value with the underlying statistic is computed (here t-test or Man-Whitney).

Permutations with a p-value ≤ userdefined threshold (alpha) are used for computation of the resampling p-value and mean-p:

pResampling = 1 - NSuccess/NIteration


with: NSuccess = Number of permutations where p≤alpha; NIteration = total number of permutations.

p-mean = geometric mean from all individual permuations' p with p≤alpha.

The test adds three additional "annotations columns to the data matrix:
- n-success
- p-resampling
- mean p-resampling

p-permutation may range from
- 1 = no single permutation resulted in the case p≤alpha)
- 0 = all permutation resulted in the case p≤alpha)
Like with any other permutation test, the highest achievable significance refers to the number of permutations.
With 1000 permutations the best meaningful p-value would be 0.001.


From SUMO's main menu select Analyses | Resampling test.

The group selection dialog opens up.
Define number of required groups and assign samples to the respective groups as usual:


Go to the parameters page:


Select type of statistic for underlying tests:
Depending on the the number of defined groups, SUMO selects the corresponding (1-/2-/Muli-class test).

Select resampling method:

Iterations: number of permutations to generate.
As more as better. But: as more permutations as more execution time is required.
Anyhow: The number of permutations should be adopted to the group sizes.
Assume 2 groups, 3 samples each, 66% sample size.
There exist ~16 posible permutations.
Running a thousand permutations would mean: you repeat the 16 possible permutaions ~60 times.
=> p-values are not expedient.
SUMO does not check for or exclude redundant permutations !

Sample size: Portion of samples to be randomly selected from the original groups.
Assume 2 groups, each with 40 samples, 80% sample size.
For each permutation, 32 samples are randomly selected from, each of the two groups.


Click OK or Run button to perform the test.


When finished, close the notification message box.

Now you may filter genes by the resampling test results.

Define a critical p-value and see how many featuers (genes) pass the test:

Click No-button to adjust the critical p-value (resulting in less / more genes to be filtered).
Click Yes-button to show filtered features in a heatmap.
Click Cancel-button to just finalize. Test resutls are anyhow appended to feature annotations in the loaded data matrix.


Additionally, a histogram is shown, indicating the multiplicity how often individual genes were significant in the resampling test.

The example shows non-significant results.
None of the tested ~150 genes was >40x significant in all 100 permutation cycles.
=> p>0.6 - non significant.


File utilities

Here you may find some utilities to parse / convert data files.


XML => TSC converter

Convert a XML file into a list of tab delimited Key-Value pairs.

A XML-key without value will get an empty value "--".

Additionally, a key list file is generated in the folder where the xml files are located.
The key list contains alphabetically sorted all unique keys extracted from all converted XML files.


In SUMO select

Main menu | Utilities | File utilities | XML=>TSV

A file selection dialog will open up.
Select the xml files you wish to convert

In SUMO's LOG-window the converted files are listed, as well as the number of extracted key-value pairs:


The sample XML-fragment:
<prad:tcga_bcr xsi:schemaLocation="http://tcga.nci/bcr/xml/clinical/prad/2.7 http://tcga-data.nci.nih.gov/docs/xsd/BCR/tcga.nci/bcr/xml/clinical/prad/2.7/TCGA_BCR.PRAD_Clinical.xsd" schemaVersion="2.7" xmlns:prad="http://tcga.nci/bcr/xml/clinical/prad/2.7" xmlns:xsi="http://www.w3.org/2001/XMLSchema-instance" xmlns:admin="http://tcga.nci/bcr/xml/administration/2.7" xmlns:clin_shared="http://tcga.nci/bcr/xml/clinical/shared/2.7" xmlns:shared="http://tcga.nci/bcr/xml/shared/2.7" xmlns:shared_stage="http://tcga.nci/bcr/xml/clinical/shared/stage/2.7" xmlns:prad_nte="http://tcga.nci/bcr/xml/clinical/prad/shared/new_tumor_event/2.7/1.0" xmlns:nte="http://tcga.nci/bcr/xml/clinical/shared/new_tumor_event/2.7" xmlns:rx="http://tcga.nci/bcr/xml/clinical/pharmaceutical/2.7" xmlns:rad="http://tcga.nci/bcr/xml/clinical/radiation/2.7" xmlns:follow_up_v1.0="http://tcga.nci/bcr/xml/clinical/prad/followup/2.7/1.0" xmlns:prad_shared="http://tcga.nci/bcr/xml/clinical/prad/shared/2.7"> <admin:admin> <admin:bcr xsd_ver="1.17">Nationwide Children's Hospital</admin:bcr> <admin:file_uuid xsd_ver="2.6">C2A2058A-37FA-49BE-A806-567A9A332504</admin:file_uuid> <admin:batch_number xsd_ver="1.17">389.50.0</admin:batch_number> <admin:project_code xsd_ver="">TCGA</admin:project_code> <admin:disease_code xsd_ver="2.6">PRAD</admin:disease_code> <admin:day_of_dcc_upload xsd_ver="1.17">31</admin:day_of_dcc_upload> <admin:month_of_dcc_upload xsd_ver="1.17">3</admin:month_of_dcc_upload> <admin:year_of_dcc_upload xsd_ver="1.17">2016</admin:year_of_dcc_upload> <admin:patient_withdrawal> <admin:withdrawn>false</admin:withdrawn> </admin:patient_withdrawal> </admin:admin> <prad:patient> <admin:additional_studies/> <clin_shared:tumor_tissue_site preferred_name="submitted_tumor_site" display_order="9999" cde="3427536" cde_ver="2.000" xsd_ver="2.6" tier="2" owner="TSS" procurement_status="Completed" restricted="false" source_system_identifier="3516490">Prostate</clin_shared:tumor_tissue_site> <shared:other_dx preferred_name="history_other_malignancy" display_order="21" cde="3382736" cde_ver="2.000" xsd_ver="2.5" tier="1" owner="TSS" procurement_status="Completed" restricted="false" source_system_identifier="3516507">No</shared:other_dx> <shared:gender preferred_name="gender" display_order="14" cde="2200604" cde_ver="3.000" xsd_ver="1.8" tier="1" owner="TSS" procurement_status="Completed" restricted="false" source_system_identifier="3516500">MALE</shared:gender> <clin_shared:vital_status preferred_name="vital_status" display_order="59" cde="5" cde_ver="5.000" xsd_ver="2.6" tier="2" owner="TSS" procurement_status="Completed" restricted="false" source_system_identifier="3516545">Alive</clin_shared:vital_status> <clin_shared:days_to_birth precision="day" xsd_ver="1.12" tier="1" cde="3008233" owner="TSS" procurement_status="Completed" preferred_name="birth_days_to" display_order="20" cde_ver="1.000">-18658</clin_shared:days_to_birth> <clin_shared:days_to_death precision="day" xsd_ver="1.12" tier="1" cde="3165475" owner="TSS" procurement_status="Not Applicable" preferred_name="death_days_to" display_order="67" cde_ver="1.000"/> <clin_shared:days_to_last_followup precision="day" xsd_ver="1.12" tier="1" cde="3008273" owner="TSS" procurement_status="Completed" preferred_name="last_contact_days_to" display_order="63" cde_ver="1.000">621</clin_shared:days_to_last_followup> ...
would be converted to:
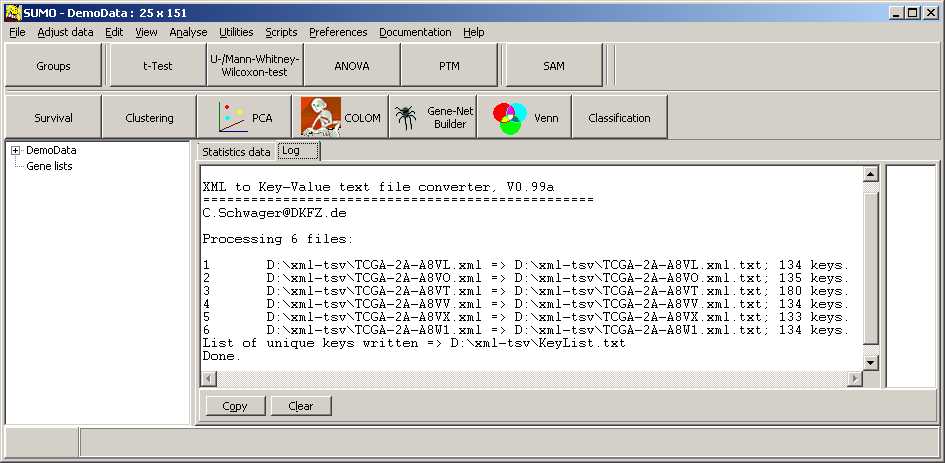
TCGA-2A-A8VL.xml	--
xml	--
prad:tcga_bcr	--
admin:admin	--
admin:bcr	Nationwide Children's Hospital
admin:file_uuid	C2A2058A-37FA-49BE-A806-567A9A332504
admin:batch_number	389.50.0
admin:project_code	TCGA
admin:disease_code	PRAD
admin:day_of_dcc_upload	31
admin:month_of_dcc_upload	3
admin:year_of_dcc_upload	2016
admin:patient_withdrawal	--
admin:withdrawn	false
prad:patient	--
admin:additional_studies	--
clin_shared:tumor_tissue_site	Prostate
shared:other_dx	No
shared:gender	MALE
clin_shared:vital_status	Alive
clin_shared:days_to_birth	-18658
clin_shared:days_to_death	--
clin_shared:days_to_last_followup	621
...


JSON => TSC converter

Convert a JSON file into a list of tab delimited Key-Value pairs.

A XML-key without value will get an empty value "--".


In SUMO select

Main menu | Utilities | File utilities | JSON=>TSV

A file selection dialog will open up.
Select the JSON files you wish to convert

In SUMO's LOG-window the converted files are listed, as well as the number of extracted key-value pairs:


The sample JSON-fragment:
{ "store": {
    "book": [ 
      { "category": "reference",
        "author": "Nigel Rees",
        "title": "Sayings of the Century",
        "price": 8.95
      },
      { "category": "fiction",
        "author": "Evelyn Waugh",
        "title": "Sword of Honour",
        "price": 12.99
      },
      { "category": "fiction",
        "author": "Herman Melville",
        "title": "Moby Dick",
        "isbn": "0-553-21311-3",
        "price": 8.99
      },
      { "category": "fiction",
        "author": "J. R. R. Tolkien",
        "title": "The Lord of the Rings",
        "isbn": "0-395-19395-8",
        "price": 22.99
      }
    ],
    "bicycle": {
      "color": "red",
      "price": 19.95
    }
  }
}

would be converted to:
root::store:bicycle:color	red
root::store:bicycle:price	19.95
root::store:book:0:title	Sayings of the Century
root::store:book:0:author	Nigel Rees
root::store:book:0:category	reference
root::store:book:0:price	8.95
root::store:book:1:title	Sword of Honour
root::store:book:1:author	Evelyn Waugh
root::store:book:1:category	fiction
root::store:book:1:price	12.99
root::store:book:2:title	Moby Dick
root::store:book:2:isbn	0-553-21311-3
root::store:book:2:author	Herman Melville
root::store:book:2:category	fiction
root::store:book:2:price	8.99
root::store:book:3:title	The Lord of the Rings
root::store:book:3:isbn	0-395-19395-8
root::store:book:3:author	J. R. R. Tolkien
root::store:book:3:category	fiction
root::store:book:3:price	22.99


Random number generator


At several places SUMO uses random numbers (e.g. to generate demo data, Mixer-tool).
Depending on the applicaton it may be valuable to generate random numbers that follow a certain distribution.

In SUMO select

Main menu | Utilities | Random numbers

A file Parameter dialog opens up:


Select

Examplary 1000 gaussian (mean=0, sdev=1) distributed random numbers:

Graph:


Histogram from this random number series:

Obviously, the relaive small random number set can not generate a "perfect" Gauss distribution.