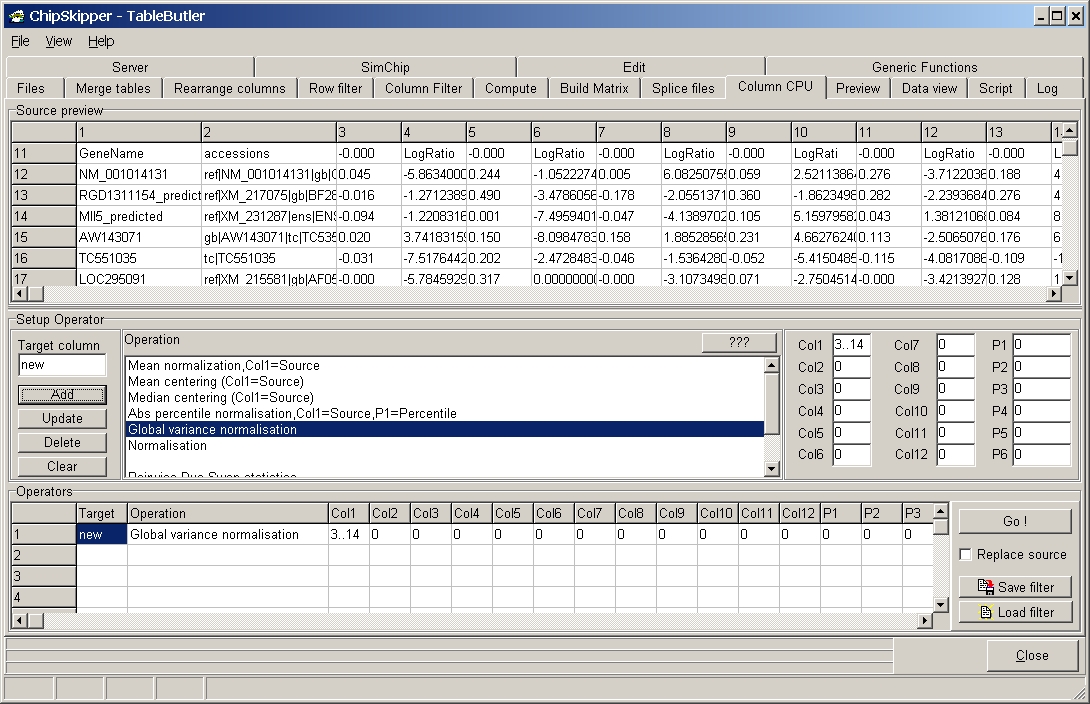
Here you can use TableButler to recompute the data values column dependant.
To calcualate datavalues rowdependant go to Compute-tabsheet.
TableButler shows a preview of the data file :

To set-up a single Operation do the following steps:
By default, TableButler saves the result in a new file with extension "_ccp" (e.g.
selected file is "my_table.txt", a result file with name "my_table.txt_ccp" will
be created.
To overwrite the source file check the Replace Source check box.
If you want to reuse a set-up list of operations, save the "filter" by
clicking the Save filter button.
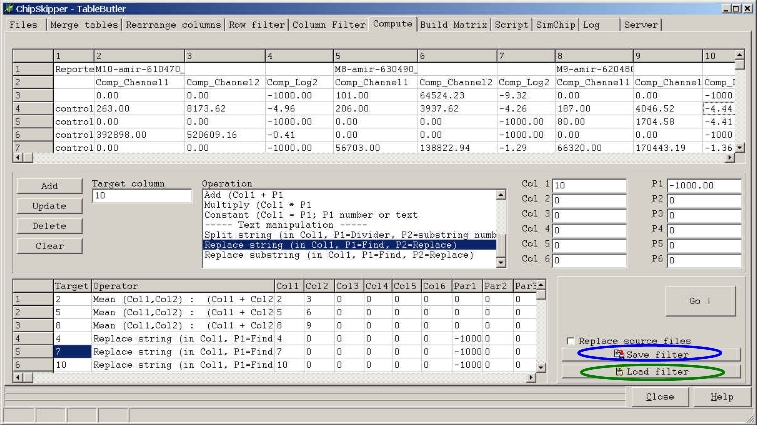
In a next session reload the filter by clicking the Load filter button.
Click a colum in the preview grid, then click the Target column field to define where the result of the operation shold be placed, or leave target column empty tp append the new data as new data fields.
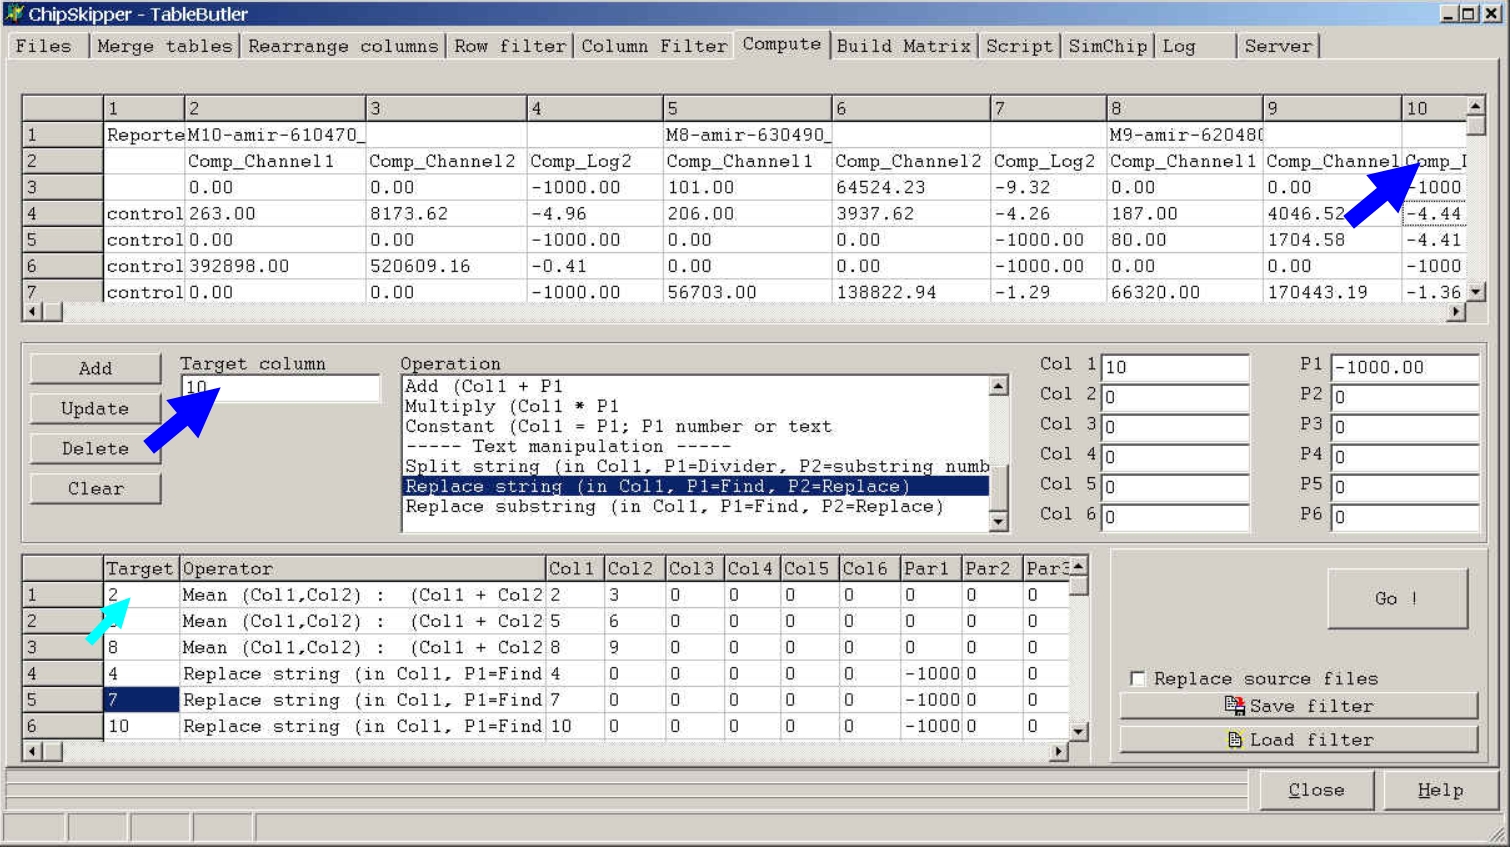
If you later click the Add button the respective Target Column value will
show up in the Filters list.
If you do not supply a Target Column value (= leave field empty) or type
new, the result of the operation will be appended to the table.
Some operations will create multiple column results or place the results in the
source cells.
See more details for the respective functions.
Click a colum in the preview grid, then click the
Col1, Col2,
...
to select the columns for the operation:
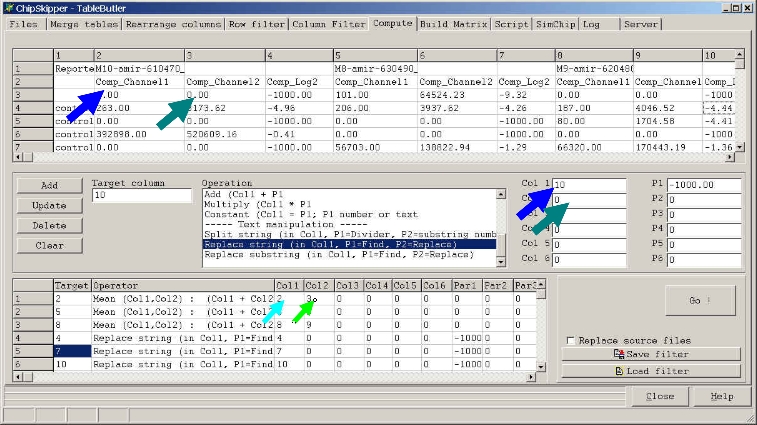
If you later click the Add button the respective Target Column value will show
up in the Filters list.
If you want / need to define a larger number of source columns you can also
define a simple regular expression range expression in edit field Col1.
Either define a
e.g. 2,3,6..10,12,13,20..24 will select columns 2,3,6,7,8,9,10,12,13,20,21,22,23,24
You can also use add multiple coluns to the Col1-edit field by Double-Clicking a column in the preview grid while holdeing Ctrl-Key pressed.
Select the requested operation from the Operation list:

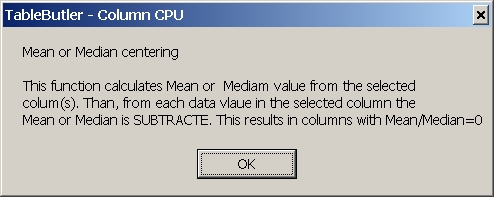
To get a brief description pf the selected operation, click the
information button ( "???" ).
A windows message box pops-up showing brief essential information about
the selected operation.
For more details about an operation see below.
At present the following operations are available:
Enter required parameters into P1..P6
Add filter to the list of filters and run filter.
A defined filter may contain multiple operations and may be saved for later use.
The examples shows global variance normalisation of data columns 3 to 14 from aexpression matrix created with Expression matrix builder of TableButler.
When working with log-ratio values from differnt hybridisations it may happen that the ratio distribution (magnitudes of ratios) is different due to experimental differences. To mine such data it may be useful to equlibrate the data before clustering or statistical analysis (t-Test, ANOVA, SAM, ...).
This function claculates variance from all numericals in
each of the selected columns and divides all numerical value in any of the
selected columns by the squareroot respective column's varaiance.
This will result in recomputed columns having varince ==1.
E.g.:
| Starting values | 8.0 | 4.0 | 6.0 | 10.0 | 4.0 | 12.0 | 2.0 | 8.0 | 10.0 |
| Variance | 11.1 | ||||||||
| Normalized | 2.4 | 1.2 | 1.8 | 3 | 1.2 | 3.6 | 0.6 | 2.4 | 3 |
Like any other statistical method, extreme outliers might
scramble up this normlaization (e.g. irregular ratios from spots with zero
intenities in one or the other colour).
To avoid this TableButler can sort the column values and exlcude a certain
percentile of lowest / highest data values from normalization. I.e. those values
are not used for calculation of global variance.
To do this define
| Parameter P2=xx | xx% of highest and lowest spots are
excluded from variance calculation. e.g. 10000 data values, P2=1 => 100 lowest / highest values are not used to calculate variance. |
This function perform allows to perform a lowess like
normalisation.
Use intensity values for colour channel 1 and 2 and do a weighted local linear
regression.
Parameters:
Col 1: "Red" intensity
Col 2: "Green"
Col 3: Additional "Flag" column
In this
column, A=Absent and M=Marginal are used to exclude the
respective
spots, whereas spots with P=Pass are used to compute
normalisation
factors.
Col 4: Furthermore a feature description column (defined in edit
field Col4)
may be used
to filter spots. Supply a list of space separated values to be
searched (e.g.
"control oligo h20 buffer") in editfiled P6
Normalisation values are extracted from the filtered spots only, nevertheless
ALL spots are normalized.
Parameters:
P1 normalisation method: (default=LL-L)
LL-M = lowesslike, mean centering
LL-D = lowesslike, median centering
LL-U = lowesslike, mode centering
LL-L = lowesslike, linear regression
P2 defines the number of spots in the sliding window (default=250)
P6 Filter for feature description (eg. "control,cy3")
To use larger number of search values
you can use a
simple text file (one search value
per line)
Enter into P6: "file=c:\mypaht\myfile.txt
Results may be appended as additional columns:
Compensated Red intensity
Compensated Greeen Intensity
Compensated differential ratio
Compensated log2 ratio
P5 define what will be appended:
if empty all 4 columns will be
appended (default)
specify "cr" to add red comp.int.
"cg" to add
green comp.int.
"cd" to add
comp.diff.ratio'
"cl" to add
comp.log.ratio'
or any
combination of those (e.g. "cr,cg,cl")
This function calculates pairwise linear regression
between all selected columns from all selected files, returning correlation
coefficients for each pair.
The result is written as html file showing square matrices with correlation
coefficients for each pair.
The lower (redundant) triangular matrix is omitted.
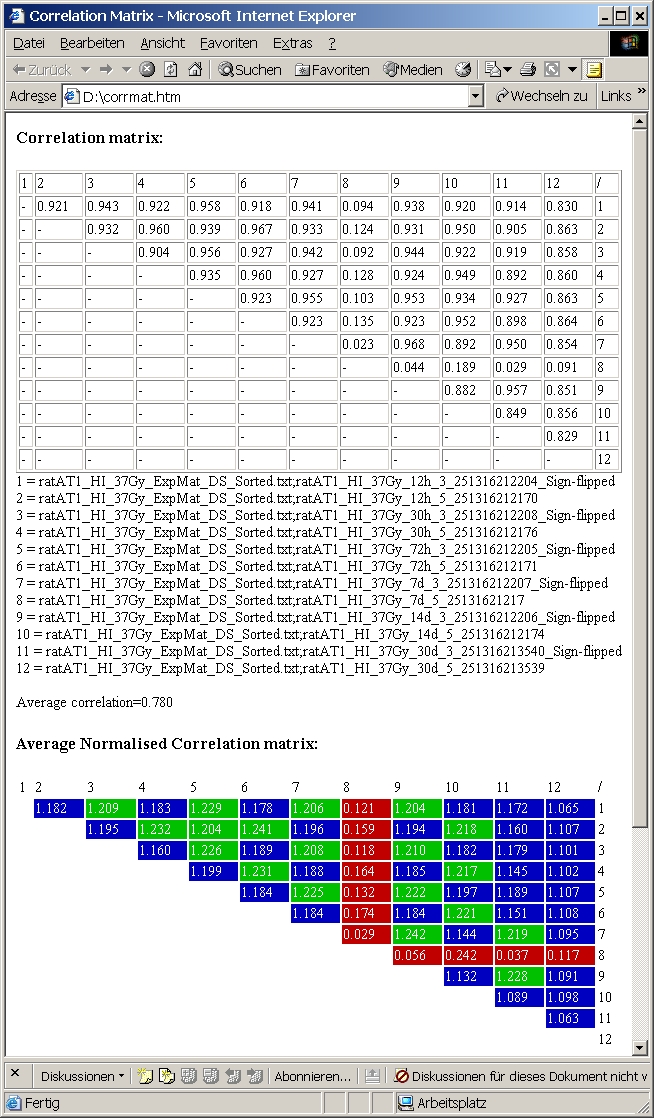
Below the matrix names of columns are listed.
Additionally a colour coded "normalized" correlation matrix is shown. Mean correlation coefficient is calculatee from all pairs and used to normalize all correlation coefficients:
The example shows 6 hybs with dye-swaps from an experiment
with increasing dose-treatment.
The color coded normalized correlation matrix nicelly shows, that in general
normal / dye-swp hybs show better correlation.
Hyb 8 (red) does not correlate with anything else.
Last edited 17.03.2006,