Heatmap
A loaded expressionmatrix / tree is shown as a heatmap:
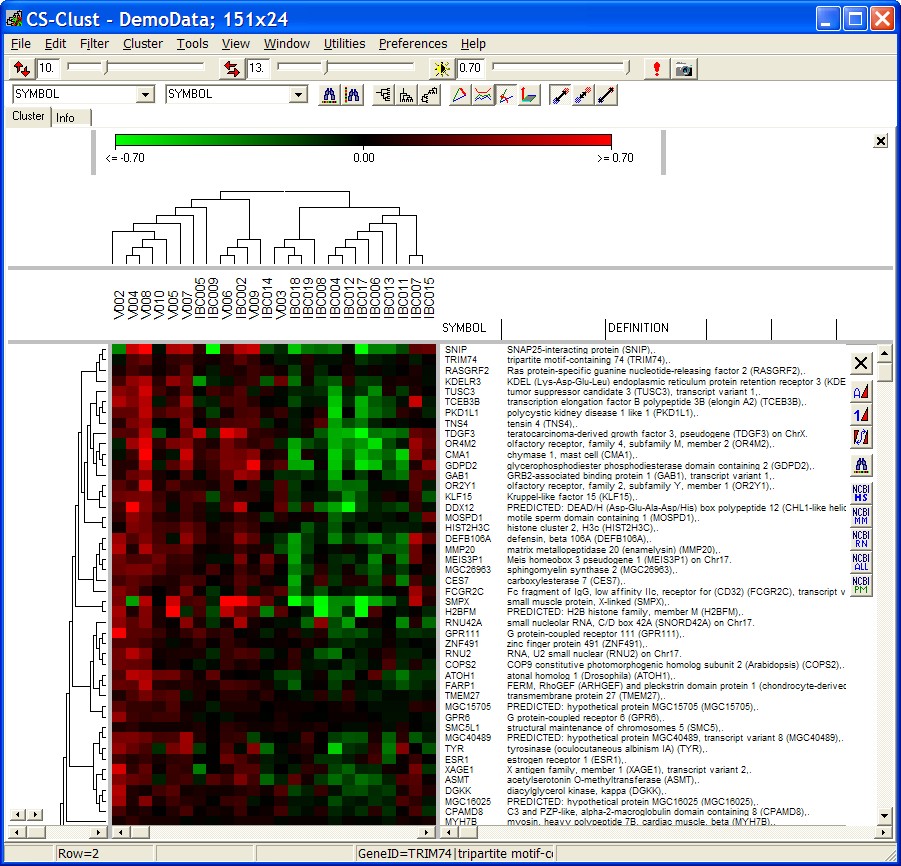
The panels show
- top panels:
- scale bar
- Condition tree (in case conditons have been clustered)
- Condition (hybridisation) annotations
- left panel: gene tree (if genes have been clustered)
- middle panel: the heat map
- right panel: gene annotations
Click left mouse button on any of the gray dividers to size the individual panels.
Each coloured box represents the expression value of one
gene at one condition.
By default a green-red colour schema is used to represent the expression values:
- green -> black represents negative values (=down-regulation)
- black -> red represents positive value (=up-regulation)
In the status bar, the values for a single data cell are shown while moving the mouse across the heatmap:
- Row: Index of gene
- Column: Index od condition
- Ratio: Numerical value of the cell
- GeneID: Annotation of the gene
- SampleID: Annotation of The hybridisation
Use Main menu as well as tool bar controls to customize the view and process the data.
Click with right mouse button into any of the panels and perform context specific actions.
View
The View menu allows to select annotations and open additional data views:
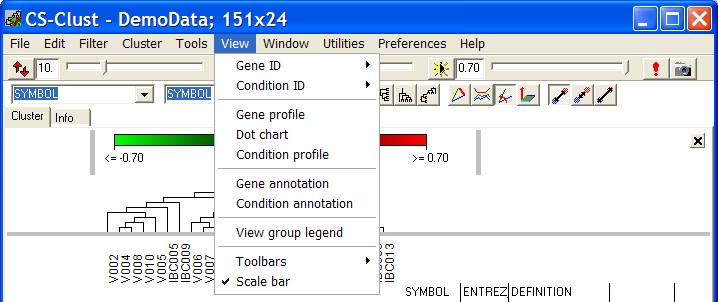
GeneID
When multiple Gene Annotations are available, you
can select which annotation shall be displayed in the heatmap view.
Open the submenu to select one of up to 9 directly selectable Annotations.
In case there are more then 9 annotations select other.
Now you can select the Gene Annotation to use.
Alternativel use the right drop down list in the tool bar or right click the Gene annotation headers.
ConditionID
In the same way as decribed above, you can select the hybridisation annotations.
Alternativley select the left drop-down list on the main toll bar.
Gene profile
This option opens a line plot of the gene's expression values across all hybridisations:
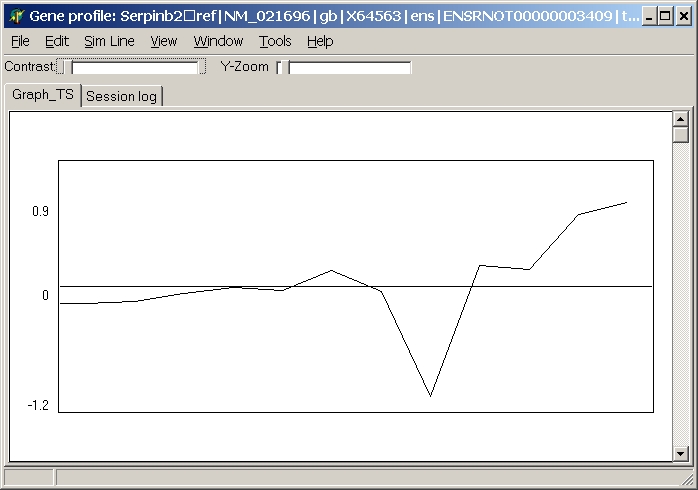
The line plot will be automatically updated when moving the mouse across the heatmap.
Condition profile
This option opens a line plot of the condition's (=hybridisationn's)
expression values across all genes:
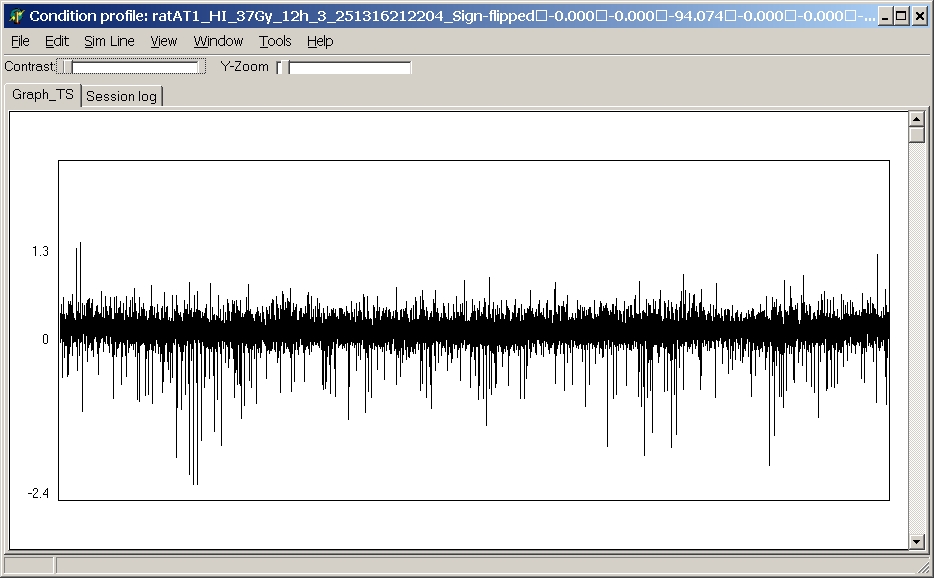
This line plot will be automatically updated when moving the mouse across the heatmap.
Dot chart
This options opens a a dot chart for a single gene:
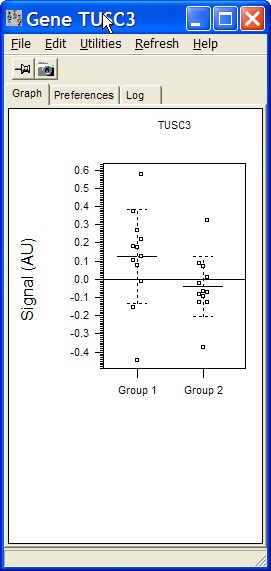
All expression values from each group
(e.g. the groups settings from a prevous SUMO statistical test) are summarized in a single dot-group.
The dot chart will be automatically updated when moving the mouse across the heatmap.
There is a variety of possibilities to customize the dot chart
Gene annotation
This options opens a table viewer, showing all gene annotaions:
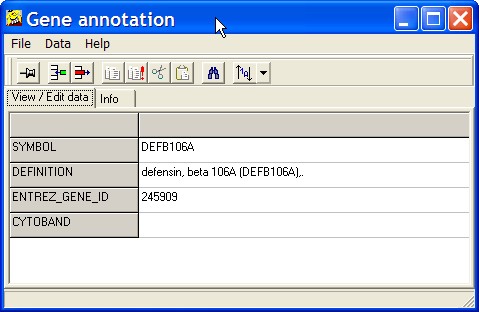
This view may be helpful if you have a large number of gene annotations in your expression matrix.
Condition annotation
This options opens a table viewer, showing all condition annotations:
This view may be helpful if you have a large number of condition annotations in your expression matrix.
Group lengends
This options opens a panel within the heatmap window, showing names / colours of defined hybridisation gropus:
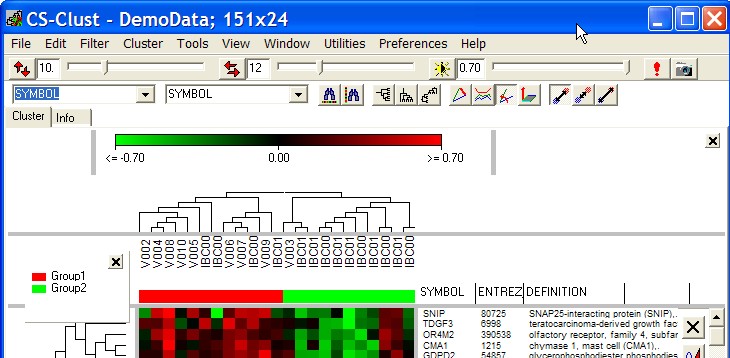
The panel may be freely placed within the window: click with right mouse button into the border of the panle and drag it around.
Tool bars
Toggle display of the different toolbars:
- Size color adjustment: the upper main toolbar
- Find and Cluster: the lower maion toolbar
- Gene names: the vertical toolbar in the genen annotation panel
Scale bar
Toggle display of the scale bar on top of the heatmap, visualizsing color / regulation scaling
Utilities
Gene annotation counter
Often you find replicated hybridisation probes on a microarray.
- The same hybridisation probe is found replicated (e.g. identical same oligo)
- For the same gene you find multiple non identical hybridisation probes
- For the same gene you find different transcript / splicing variants
Display the respective Gene annotation (e.g. Gene symbol)
Now you can easily count the number of unique gene symbols and get a brief histogram about replication distribution.
The unique gene annotations are listedn in the Infop tabsheet. You may copy them for later use.
The number of unique genes is required when computing gene-set enrichement p-values.
Demo data
A little damo data set is displayed. So you can easily explore all functonalities without generating or loading an expression matrix.
Reset panels
In case position and sizes of the display panels is scrambled up, this option will resize and rearrange all panels
Preferences
Under Preferences you find several options how to customize general display options.
Heatmap
Here you find options how to customize the "Heatmap" appearance.
Colors
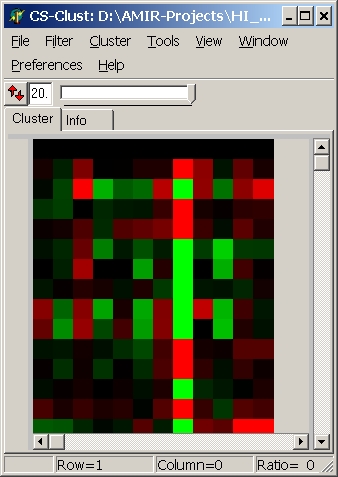
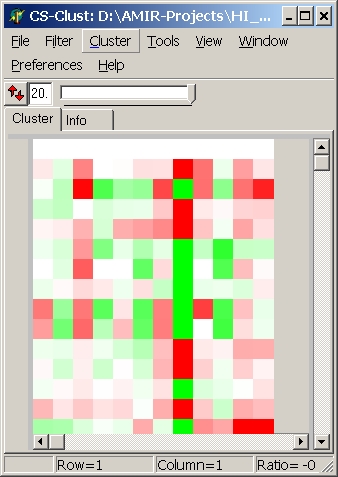
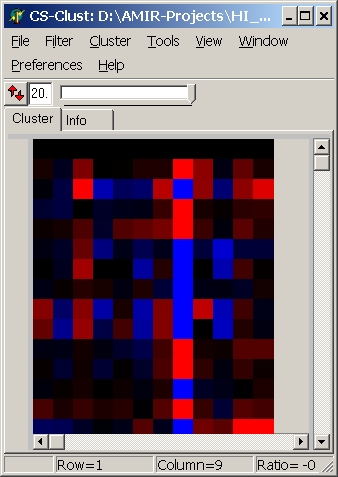
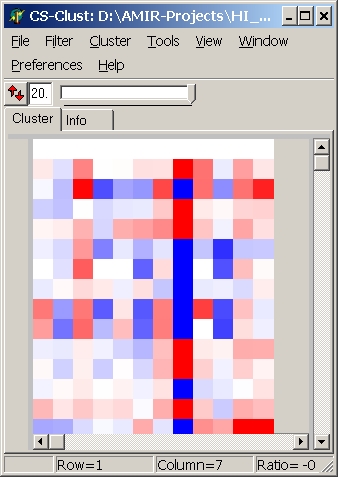
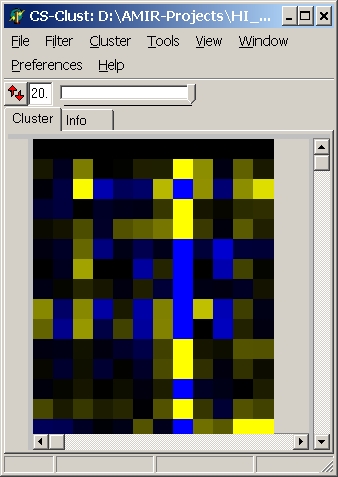
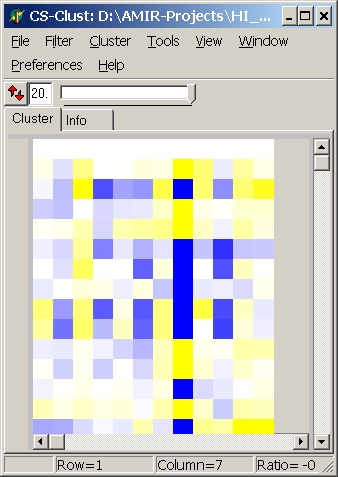
Here you can define which colouring schema is used:
| |
Black -> Colour |
White -> Colour |
red - green
(default) |
 |
 |
| blue - red |
 |
 |
| yellow - blue |
 |
 |
View intensity scale bar
Toggle display of scale bar for colouring of intensities / ratios.
Clear file history
Under File menu, the recently used expression matrix files are listed for fast reloading.
This option allows to clear all history entries.
Colors
Set background color.
Fonts
Set font size for condition- or gene annotations.
When zooming the heatmap, the size of annotation's text remains fixed.
Toolbar
In the toolbar you find several controls to adjust size, scaling of the
heatmap and corresponding trees, select annotations, or short cuts to heatmap functions:

Main toolbar - Top:
 |
Adjust "height" of genes and corresponding tree.
Use slider to interactively change the height.
Enter a number into the edit field (=Height in pixel)
Press the Up/Down arrow button to auto size gene height. |
 |
Adjust "width" of genes and corresponding tree.
Use slider, text field and button as described above. |
 |
Adjust colouring contrast.
Use slider, text field and button as described above. |
 |
Auto adjust all three: width, height, colour |
 |
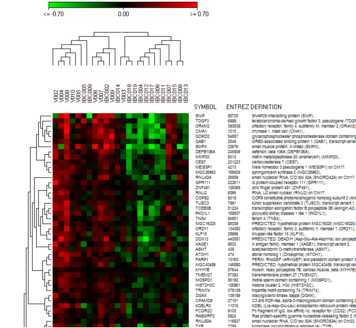
Take a snapshot of the Heamap.
Only the heatmap, no menu, tool-, scroll bars, no dividers, white background:
 |
Main tool bar - Bottom:
 |
Left drop downlist: Select a single
HYBRIDISATION annotation to be displayed on top of the heatmap.
|
 |
Right drop downlist: Select a single
GENE annotation to be displayed right from the heatmap.
|
 |
Search in gene annotations.
A input dialog open up. Type (or paste) a single key (or multiple keys divided by spaces).
Matching hybridisations will be slected and hghlightes.
|
 |
Search in gene annotations.
By default, only perfect matches (not case sensitive) are searched (e.g. "vegf" will not find "vegfr".
Multiple genes (up to 10000), divided by white spaces, may be defined (e.g. "vegfa gapdh actb").
Matching genes are selected and highlighted.
Additionally, the enrichement of the searched genes in the top of
the heatmap is computed accordng to the Man-Whitney test.
Ts is in particular useful, when genes from a statistical test are displayed and have been sorted by
increasing p-value.
Now you may easily test: is a list of reference genes (e.g. pathway) enriched in the highly significant
genes or spread acsross all genes.
|
 |
Cluster genes. See more details
NB: UP to 1000 genes - fast.
up to 5000 genes - slow
up to 10000 genes - very slow, but will most probably work
up to 15000 genes - even slower, might work but might also crash SUMO
more genes - will most probably crash SUMO immediately.
|
 |
Cluster conditions.
|
 |
Cluster both, gens and conditions.
|
 |
Use Euclidean distance for clustering. See details.
|
 |
Use Pearson correlation distance for clustering. See details.
|
 |
Use cosine distance for clustering. See details.
|
 |
Use dot product for clustering. See details.
|
 |
Use average linkage for clustering. See details.
|
 |
Use single linkage for clustering. See details.
|
 |
Use complete linkage for clustering. See details.
|
Gene annotation tool bar:

 |
Close and hide gene annotation toolbar.
To show it agian, select Main menu | View | Toolbars | Gene names.
|
 |
Sort genes ALPHAnumeric by gene's annotations.
By default, the first displayed gene annotation column is used.
If you have displayed multiple gene annotation columns, click the button with Shift key pressed:
Now you can define which column shall be used for sorting.
NB: Alphanumeric sorting "ABC" is before "ABA", "100912782334" is before "11" !!
NB: Sorting is not possible if genes have been sorted by clustering !!
|

| Sort genes NUMERIC by gene's annotations.
By default, the first displayed gene annotation column is used.
If you have displayed multiple gene annotation columns, click the button with Shift key pressed:
Now you can define which column shall be used for sorting.
NB: NUMERIC sorting "ABC"=0 is same as "ABA"=0, "11 is before "100912782334" !!
|
 |
Invert order of genes: Top-Down => Down-Top.
|
 |
Search in gene's annotation.
See above (Main toolbar - Bottom for details).
|
 |
Look up the selected gene's information
in NCBI's gene database for Humans.
In case you have multiple gene annotation columns, keep the corresponding number
key pressed while clicking the button to look up the respective gene annotation.
E.g. You have muliple gene annotations columns selected.
Column 1: gene description, Column 2: Chromosomal localisation, Column 3: gene symbol
Press number key "3" and click the NCBI button.
The result is shown in youe default web-browser.
NB : This onyl works if your computer is connected to ther internet !!
|
 |
Same as above but search for Mus Musculus.
|
 |
Same as above but search for Rattus Norwegicus.
|
 |
Same as above but search for any specie.
|
 |
Same as above but search for publications in NCBI's Pubmed database.
|
Gene annotations
Click with right mouse button into GENE annotation panel. A context menu opens up:
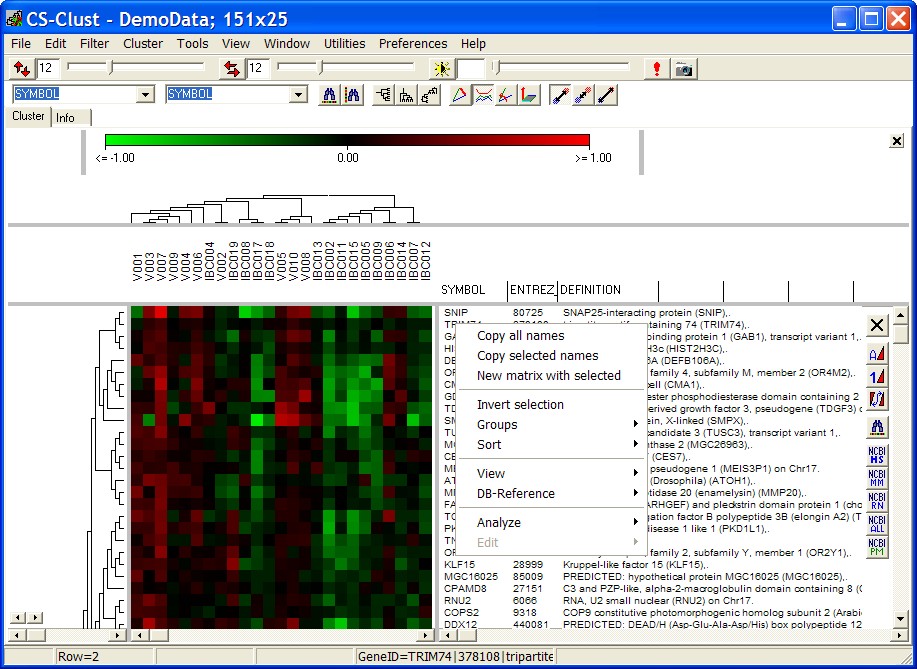
Copy all names
Copy ALL gene's annotations - one gene per line - (tab-seperated in case you have multi-columns selected) into clipboard.
Copy selected names
Copy gene's annotations from SELECTED genes into clipboard.
New matrix with selected
Open a new Heatmap viewer.
Selected genes / conditions with all data, annotations, groupings, ... are passed to the new viewer.
Invert selection
Un-select all marked genes, and select all those which have been not selected before.
Sort
Same sorting functions as with the toolbar buttons (see above).
View
Generate different views from the selected features / genes:
Selected features / genes profile
Show data from selected genes as line profile:
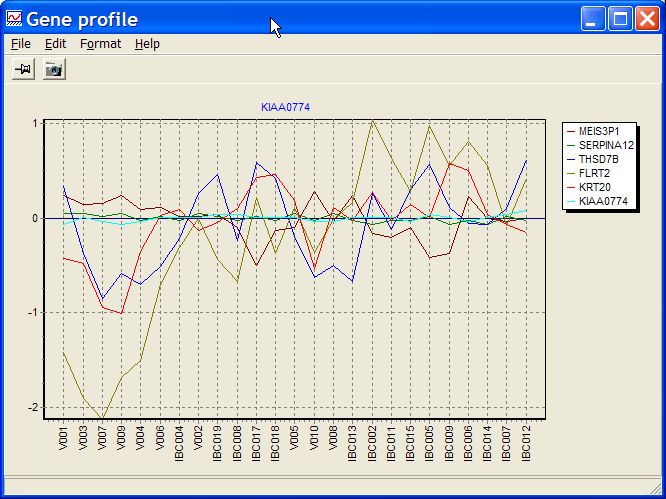
Helpful to recognize in more detail differences / similarities between different genes.
E.g. to check stability of endogenous controls
See more details how to customize profiles.
Selected features / genes STACKED profile
Show data from selected feratuers as line profiles.
In thestacked profile each feature is shown as a separate graph onr on top of the other.
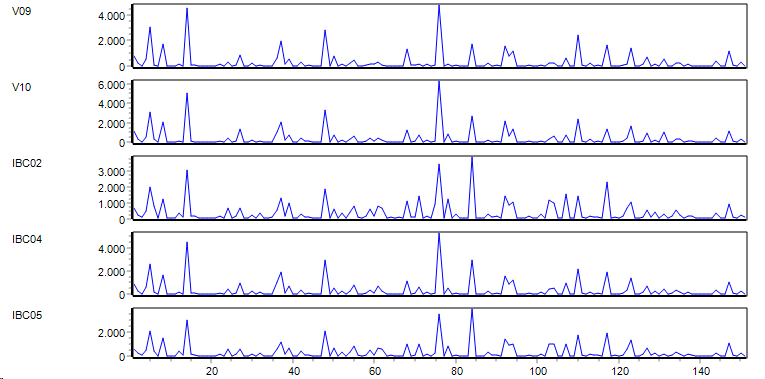
Helpful to recognize in more detail differences / similarities between different genes.
See more details how to customize profiles.
Centroid from selected genes
Compute average profile from all selected genes and display as line profile.
E.g. select a sub cluster in gene tree and view is average expression profile (centroid):
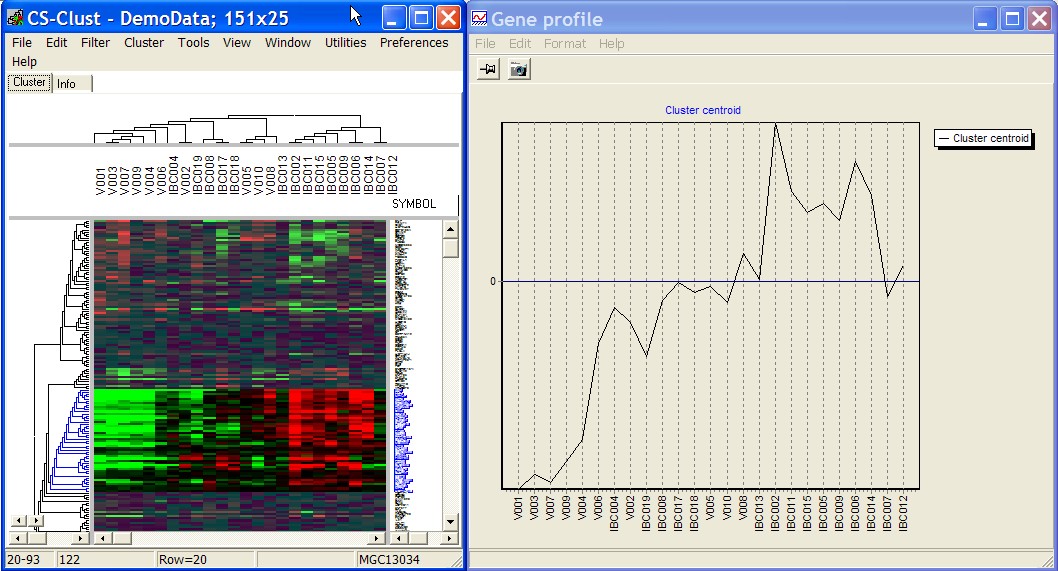
Selected genes dotchart
View expression data from selected genes as dotchart.
Different condition groups (e.g. the groups from a statistical test) are shown as individual groups.
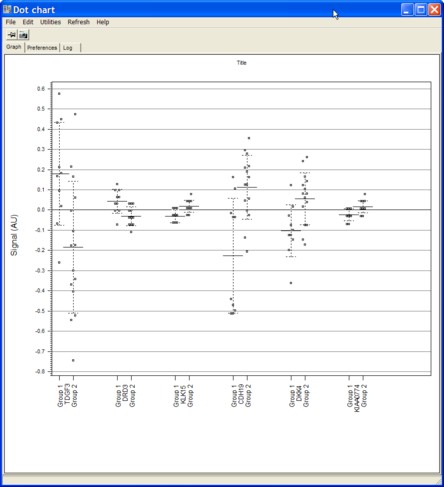
See more detail about Dot-Chart to see how to customize the chart.
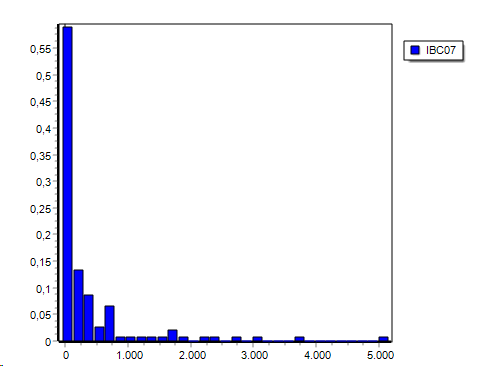
Histogram
Build histograms from selected features / genes and show them ProfileViewer.
Histograms are normalized: Area under the VCurve == 1 (density graph).
If you select multiple features, a histogram is created for each feature indiviudally ans shown.
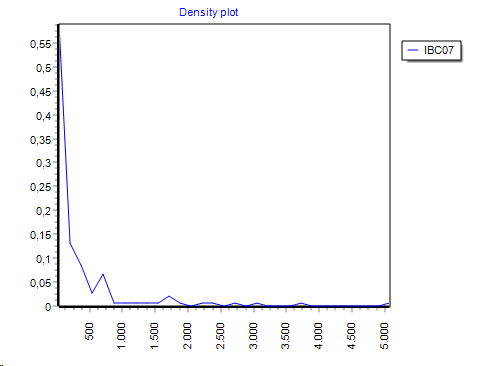
By default the histogram is showna s aline graph but you may convert it to a bar graph:
ProfileViewer | Main menu | Format | Change charttype| Bar:
Custom Histogram
Specify histgram parameters, e.g. Min / Max / Channel number.
Scatter plot
Select TWO features (/ genes to show a scatterplot of their data values as scatterplot:
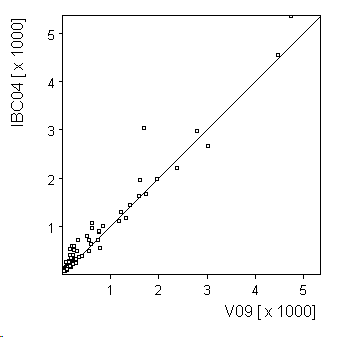
If more then two features are selected. the first two are shown.
DB-Xref
Look-up the gene in various Gene / Protein databases.
Same as with the tool bar buttons (see above), additional links to GeneCards, Ensemble and Uniprot
Annotation
Show Profile or Histogram from a freely selectable feature annotation column.
Analyze
Perform further analyses with the selected genes
Selected genes => Network builder
Try to build gene networks with the selected genes usings SUMO's Network builder
Multiple gene annotations
If you want to show multiple gene annotations, click with right mouse button into the gene annotation column header fields.
A sewlection list opnes up:
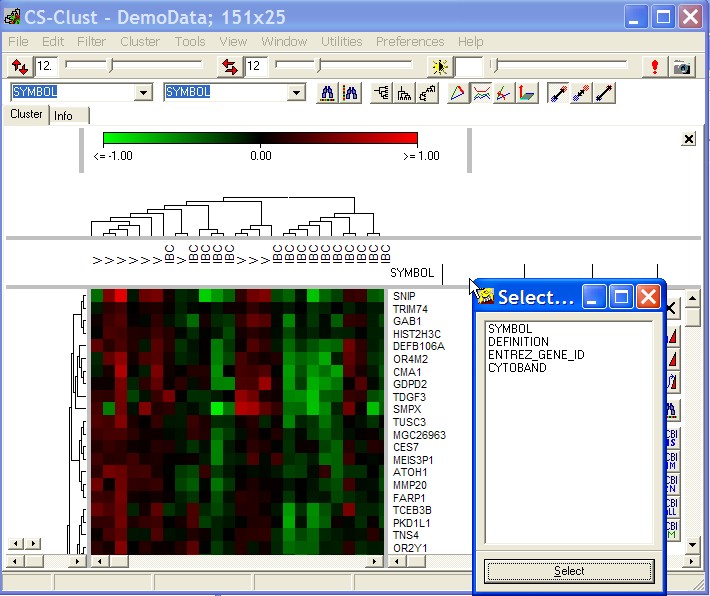
Select the respective annotation to show it the selected column.
Condition annotations
Click with right mouse button into CONDITION annotation panel. A context menu opens up:
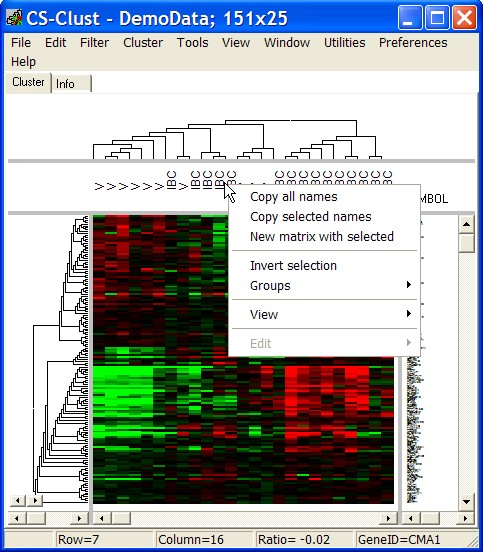
Copy all names
Copy ALL condition's annotations - one gene per line - (tab-seperated in case you have multi-columns selected) into clipboard.
Copy selected names
Copy condition's annotations from SELECTED conditions into clipboard.
New matrix with selected
Open a new Heatmap viewer.
Selected genes / conditions with all data, annotations, groupings, ... are passed to the new viewer.
Invert selection
Un-select all marked conditions, and select all those which have been not selected before.
Condition Groups
Sometimes it may be helpful to visualize Condition groupings.
Assume you have data from patients.
You might want to show how desease state, treatment and gender are distributed across you clusterd conditions:
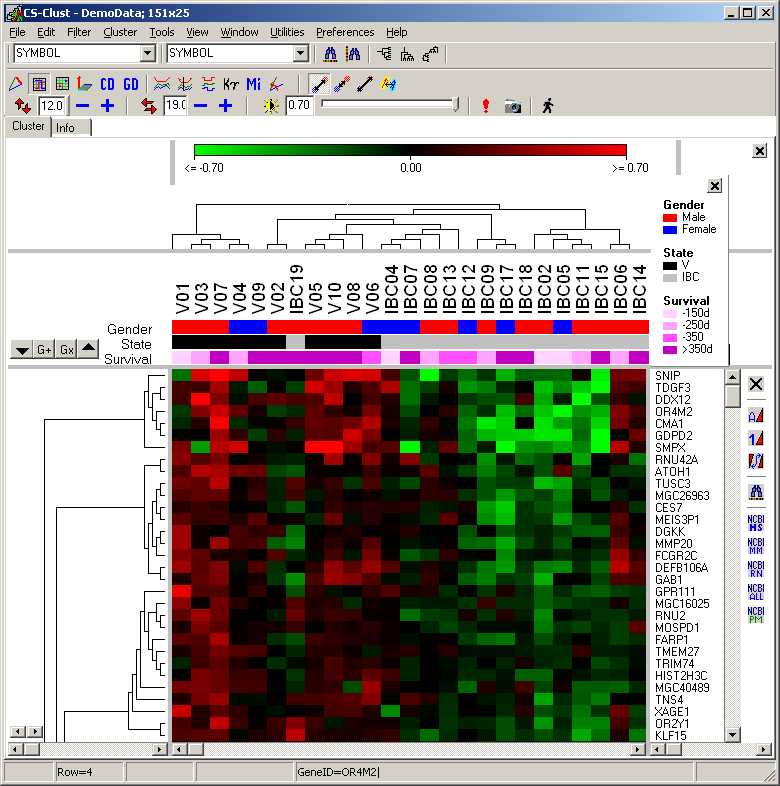
Select the conditions you want to add as new group:
- Just select the condition by clicking with the mouse into the respective samples
Use Shift+Click to select ranges
Usr STRG+Click to add / remove individual codtions to the selection.
- Search in conditon annotations
- In case you have annotation categories, Auto group the condtions:
Condtion annotation Pop-Menu | Groups | Autogroup selected
E.g. you have gender information male/female) => auto group
Click the G+ button to add all selected conditons as new group to lowest groupline.
A default color is used for the added group.
Click SHIFT+G+ button. Immediately define a color for new group.
You may create up to 256 groups per group line.
to visualize groups from an additonal different annotation category (e.g. State / Survival.
Click the Arrow-up button to open a new group line (belwo the already existing ones).
Click SHIFT+Arrow-up button to immediately set the name for the new group line.
Click into a group (any conditon member).
From the Color-Dialog, select the new color for the selected group.
Shift+Click into a group (any conditon member).
From the Input-Dialog, select the new color for the selected group.
Click into the name - left of the group lines, or click into respective group line keeping CTRL key pressed.
Enter / edit the name for the clicked group line.
Select the conditions you want to add (see above).
To add those to an existing group, keep Insert key pressed and click into the group to which
the selected condition shall be appended.
To add them as a New group, keep Insert key pressed and click into the group line (but not
any of the already existing groups) to which the selected condition shall be appended.
Select the conditions.
To remove those from an existing group, keep Delete key pressed and click into the group from which
the selected condition shall be removed.
Keep Delete key pressed and click into the group which shall be removed.
Click the Gx button to delete a complete group line including all groups within thie line.
A dialog opens up.
Define the ID of the group line which shall be removed, or "all" to remove all groups.
Click the Arrowe-Down button to open the Group pull down menu.
Select Save group definitions.
A parameter dialog opens up:

Unique conditon ID: To reuse the grouping with other heatmaps (different order of
conditions, varying composition of conditions) you may connect the group membership to a
unique condition ID found in the condition annotation of your heatmap.
Select the unique condtion from the the drop down list.
If this field is left empty, condtons are assigned to groups vi their column ID.
File name: Define the file name to use. Double click this field to opne a file save dialog.
Data are stored in a generic xml-like formated text file.
Click the Arrow-Down button to open the Group pull down menu.
Select Load group definitions.
SUMO tries to assign the loaded group definitions to the loaded matrix.
This requires:
- If column IDs were used to assign conditions to groups:
Exactly the same matrix structure to that from which the groups were saved.:
Same number / order of conditions
- If unique condition IDs were used:
Same conditon annotations as with the original data matrix.
- Conditons which can not be mapped will be ignored.
Show/Hide the group legend panel.
Cheque Main menu | View | View group legend to show hide the legend panel.
Click into the panel with left mose button and move it keeping left mouse button pressed within the heatmap window.
Gene Groups
In the same way as with conditions (see above) you may define and manipulate gene groups.
Use the Gene Annotation context menu, use the same key-mouse-click combinations in the gene annotation area and use the G+, Gx, Arrow buttons right to the gene annotation.
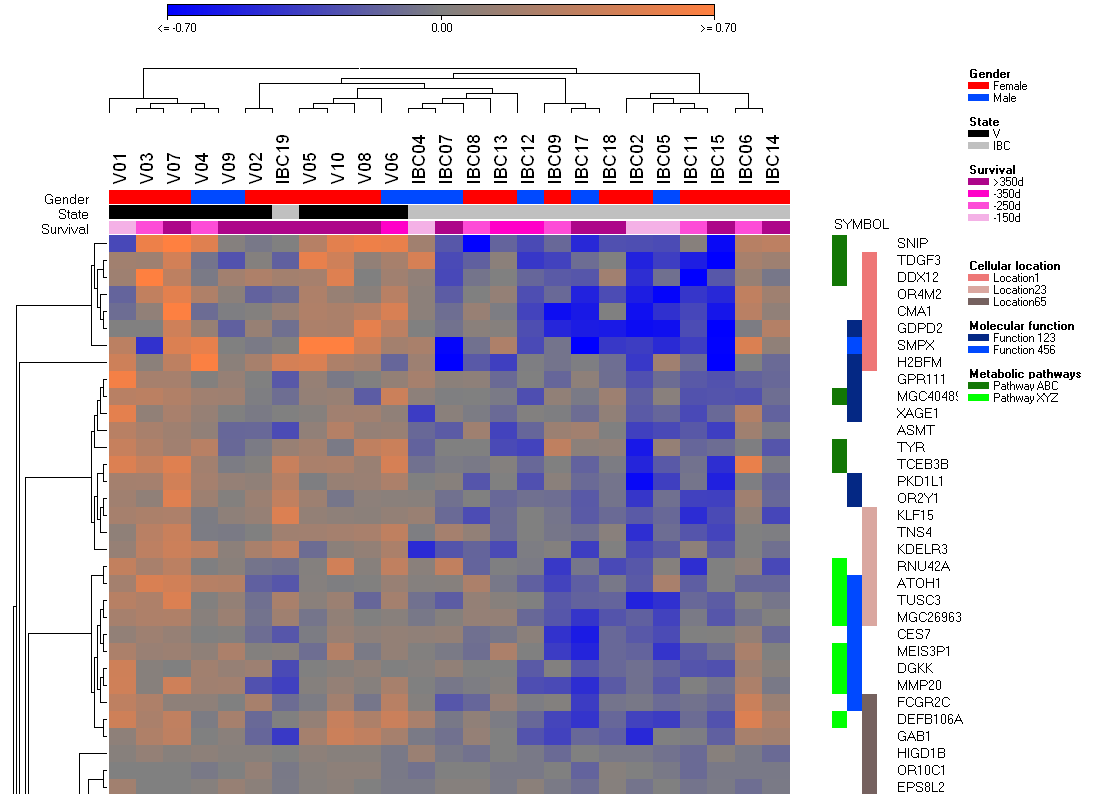
Define selected as group
Select the conditions which shall be assigned to a group.
Now "Define" the group with the context menu.
A dialog opens up.
Define the group line and name of the group.
In the above example we have three grop lines (Desease state, Treatment, Gender).
In case you would like to add a new treatment group, you should specify in the dialog:
2:3. Treatment
which tells SUMO to add a new group into line 2.
Auto group
SUMO analyses the actually displayed condition annotations, search group
names and assign the conditions to the respective groups.
In the example, SUMO would create 25 groups.
Group names
Change names for the groups.
New Group line
A new group line is opened (on Top of the existing ones).
Group line 1 is the bottom one, the others are counted from top to bottom
In the example: 1=Desease state, 2=>Treatment, 3=Gender, ...
Rename group line
Change name of an exisitn group line.
A dialog opens up.
Define group line number and new name, e.g.
2:New name
Release groups
Remove the defined groups from one or all group lines.
A dialog opens up.
Define the number of the group line from which all groups shall be removed (e.g. "2")
or specify "all" to remove all groups from all group lines.
Drag a selection rectangle whtin the heatmap (keep left mouse button pressed):
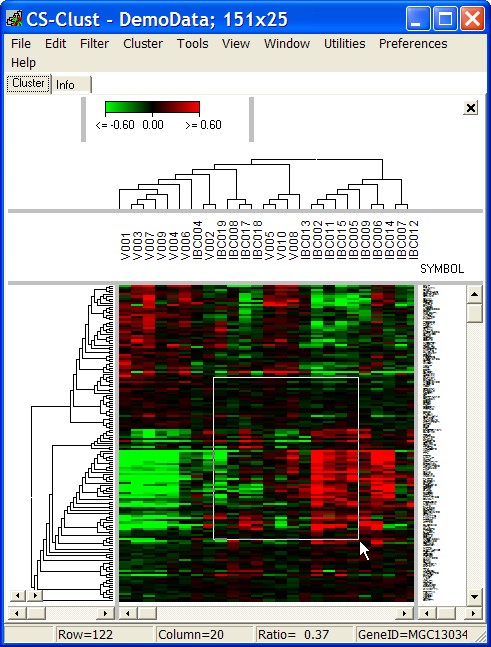
Click right mouse button in the heat map and see the selected genes and contitions:
Zoom selection
Zoom genes / conditions and scroll to first selected gene / condition so that only the selected region of the loaded heatmap is shown.
New window
Open a new heat map window and pass only selected genes AND Conditions expression and annotation values.
Save selection
Save only selected genes AND Conditions expression and annotation values as tabe delimited text file expression matrix.


