Data files
Load data as a "single flatfile data base" containg gene expression data as well as sample and gene annotations.
SUMO supports several kinds of data files / import:
Expression matrices
To load a data file goto select Main menu | File | Open Data
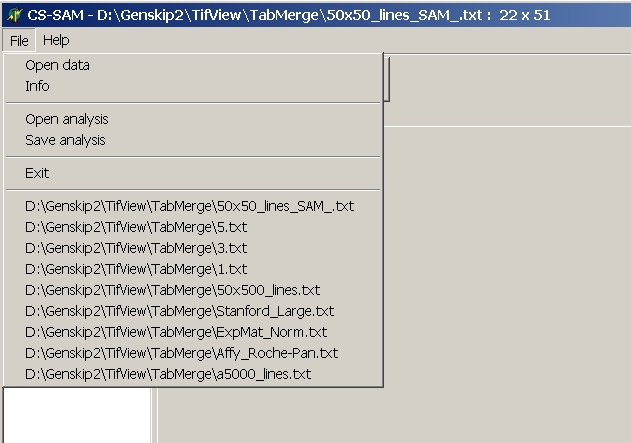
Open data
With this option you can load an expression matrix as tab-/comma-delimited text file.
In the File-open dialog box select the corresponding file type from the File-type drop-down list.
SUMO expects:
- a tab delimited text / comma delimited or EXCEL file:
Select the file type in the Open dialog's file type drop-down-list.
- Each line contains a single feature(=gene).
- Each column contains a single condition (=
hybridisation).
- All line and columns should have the same number of data cells.
- The number of columns is derived from the FIRST line in the file.
Additional data cells in later lines are ignored.
Missing data cells in later lines are interpreted as "0.00".
- Expression data should have scientific format.
e.g. "12.000" or "1.2E01".
German "decimal comma" is automatically converted into "decimal point".
Non numeric values are interpreted as "nan" (=not a number, e.g. "14.May" or
"nan"). Non numerical values might be imputed or
filtered out.
For statistical analysis, "nan"-values are interpreted as 0.00.
- Single cells can not contain internal tabs or commas respectively.
- First data lines may contain multiple column headers
describing the conditions (Hyb ID, Slide version, treatment, time point, ...)
- First data columns may contain multiple gene annotations (gene names, database
IDs, function, ...)
Such files are easily
generated from micro array databases or exported from spreadsheet programs (e.g.
MS EXCEL | File save as | Tab delimited text).
Alternatively, you may drag and drop tab-delimited text files into SUMO.
A file preview window (showing first few hundreds of lines from the selected file) opens up:
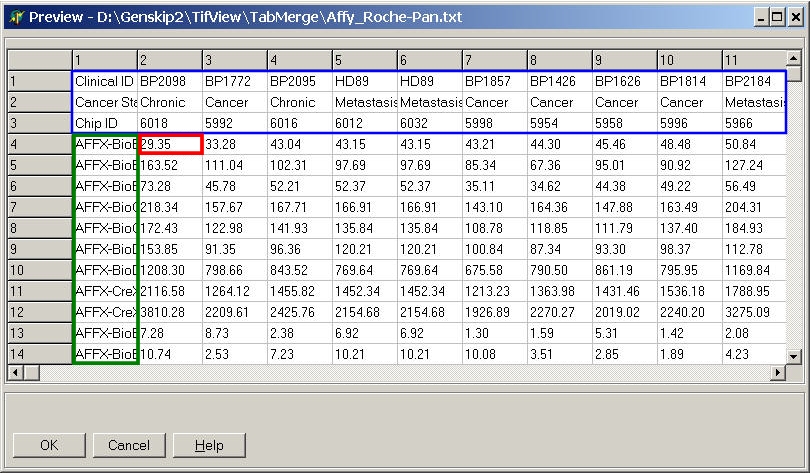
Double click the most left / upper data cell
containing expression data.
- All data right / below this cell are used for analyses
- All lines above are used for hybridisation annotations
- all columns left are used for gene annotations.
The size of the expression matrix is mainly limited by the computer's free RAM.
Analysis tree
File name and dimensions of the expression matrix are
shown in the analysis tree:
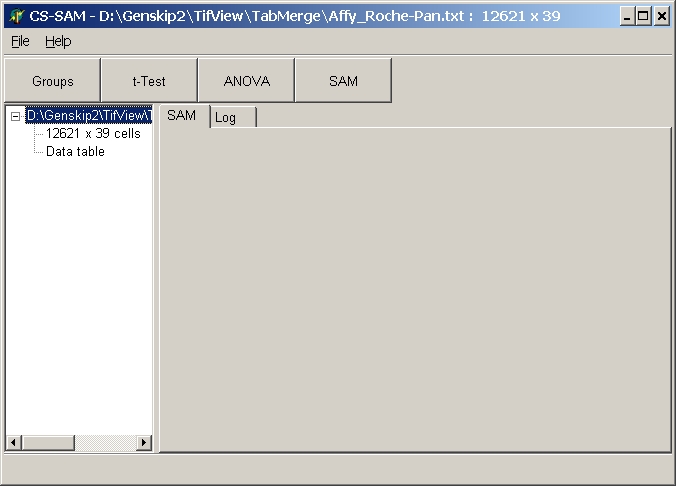
Click the Data table
node to preview the data table:
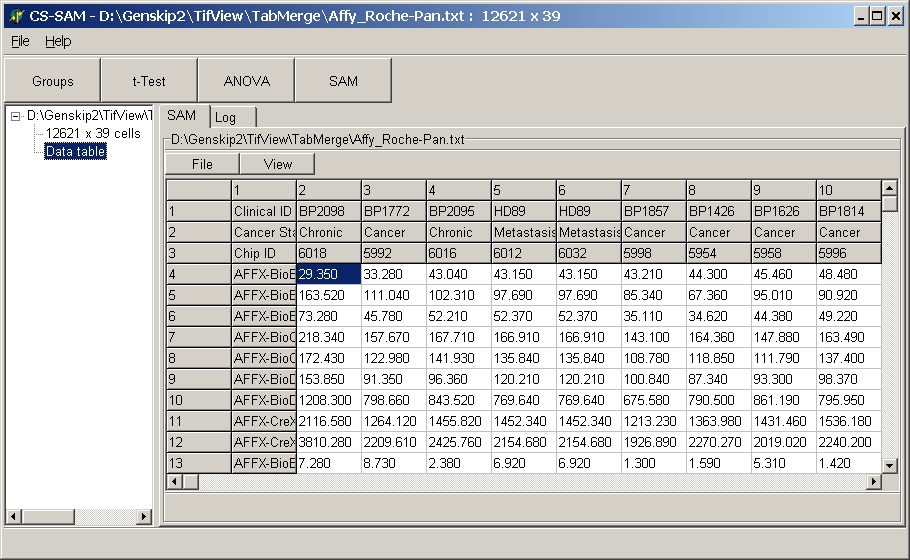
The data file is shown in a spreadsheet. For more details
see information about data tables.
SUMO analyses files
Complete analyses generated with SUMO may be saved, including expression data, backu-up data sets and the multiple
statistical tests which have been performed (no SAM analyses).
Select
Main menu | Save analysis
to save an analysis, correspondingly
Main menu | Load analysis
to load a previously saved analysis.
Amplification data files
SUMO may be used to analyze RT-PCR data.
Data generated with ABI's RQ-Manager software (exported as amplification data files) may be imported into SUMO.
Select:
Main menu | File | Import | ABI rtPCR amplification data
Select one or multiple files.
A file preview window shows up.
Ensure the correct data column (containing the CT values) is selected and load the data files.
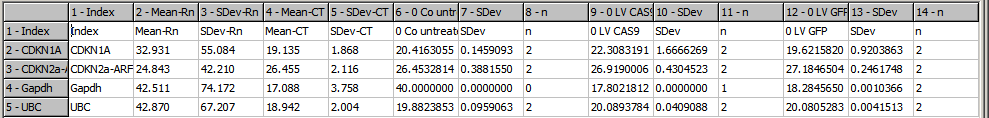
SUMO extracts RN-values (which are used as "comments", useful to identify genes
with low signal levels generating arbitrary CT-values) and CT-values.
Sometimes, very weak signal are named "undetermined" as CT-value by RQ-Manager software.
SUMO recognizes such missing values.
It is recommended to replace those values with some meanignful value (e.g. "40", the highest cycle number).
Most simple use Main menu | Adjust data | Data imputation | Row wise | Constant.
Select all samples and define "40" as replacement value.
SUMO tries to detect multiplex samples.
If found, SUMO requests a name for multiplex enodgenous controls.
I case such controls were used, give the unique name of the controls (or a unique part of the name).
IF no - cancel the dialogue.
SUMO now performs:
- find all respective multiplex controls
- comnpute grand mean-ct from all multiplex controls
- for each multiplex control compute difference = individual-control - mean-ct
- for each multiplex gene adjust : gene-ct - difference, to adjust the samples original dna-amont according to its individual endogenous control
- remove all multiplex controls
Replicates, i.e. same Gene-ID and Sample-ID are automatically averaged - even across multiple amplification data files.
Additionally, SUMO computes averages and standard deviation from both deltaRN as well as
from ct values and places them into the gene annotations. Such values might be used to filter
genes with overall low abundance (i.e. high ct-values, e.g. >35) or low signal (i.e. low delta RN , e.g. <<1).
A new file containg averaging information is automatically created
(original filename extended with "_MenaSDevN", e.g. "MyExperiment.sdm-Amplification Data_MeanSDevN.txt").
For each sample it contains three data colums:
- Mean/Median CT-value from all technical replicates
- SDev/MAD
- number of replicates
Now you may use SUMO's functionality to analyse the PCR data.
But keep in mind:
CT-values represent ~log2 values !!
- Therefore, any normalisations should be performed as "Centering", i.e. reference values
are subtracted (corresponding to division with linear intensity data).
- raw ct-values are scaled inverse compared to gene expression raw intensities:
higt ct => low abundance
low ct => high abundance
- log values: a ct difference of 2 (delta-delta-ct) corresponds to a ~4 fold regulation,
a ct difference of 5 corresponds to a ~32 fold regulation,
- After normalization (subtraction) of biological controls, you still have the difference in ct-values.
Invert the sign to convert ct-values to log2-ratios
Sparse data matrices
In cases where the vast majority of expression values is zero or otherhow non-informative - a sparse matrix - it may be efficient to save the few non-zero matrix cells in coordinate format:
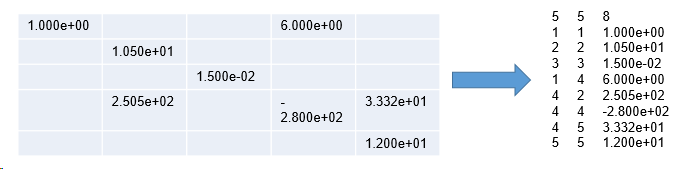
Presently, SUMO supports the MatrixMarket coordinate format, as used by e.g. 10xGenomic's Cellranger software.
Both, Row(Gene) as well as Column(Sample) coordinates should be supplied as interger values (anyhow read values are converted to integer).
Expression vales as integer or floating point, preferably with english decimal "." and thousands "," divider, although SUMO tries to convert non-english formats.
SUMO supports "symmetric" (i.e. Marix cell Mi,j = Mj,i) as well as "skew-symmetric" matrices (i.e. Marix cell Mi,j = -Mj,i), those can be used and reconstructed.
Obviously, this is only meaningful with square matrices and filtering should be skipped (see below).
"Hermetian" matrix format is not supported, SUMO is not designed to work and process complex numbers.
The matrix itself does not contain gene nor sample annotations, therfore a second genelist ("features.tsv") should be supplied and selected for loading together with the sparse-matrix file.
To open a sparse-matrix select
SUMO | Main menu | File | Open data
In the file selection dialog select as file type "Sparse matrix + Feature index":
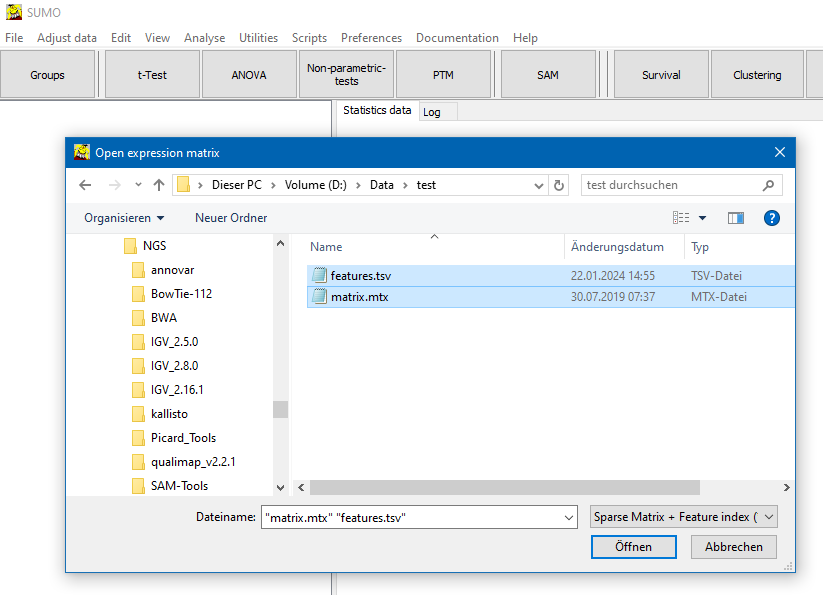
Select a Sparse matrix file (*.mtx) and optional corresponding feature list.
If eiter of the two files files is GZip cpompressed, the file should have the extension ".gz".
In a first round SUMO builds count distributions for
- Number of Conditions (e.g. single cells per Feature (e.g. gene)
- Number of Features per Condition
- Number of Counts per cell
and show them as simple "text" histograms in SUMO Log text box:

A parameter dialog opens up:
Save data as Sparse Matrix
In cases where the vast majority of expression values is zero or otherhow non-informative - a sparse matrix - it may be efficient to save the few non-zero matrix cells in coordinate format:
What does non-informative mean ?
In case of "count data" - e.g. raw genespression counts from single cell sequencing - a matrix cell will count == 0 is definitely noninformative, anything >=1 may be informative.
But you might want to use adifferent/higher threshold: a "exression" count 1 of a genen in a single sample might well be a sequence mapping or a cellular barcode identifation error with single cells.
Thus a higher threshold (e.g. 5) may be selected.
Select from main menu:
SUMO | Main menu | File | Open data
In file save dialog select "Sparse matrix" as file type.
Add ".gz" to the file names (e.g. matrix.mtx.gz") to GZip compress the matrix files using GNU GZip.exe.
In case SUMO can not found "Gzip.exe" in SUMO program folder, it will try to download "GZip.exe" from SUMO WEB site.
Next supply a threshold value to filter non-informative data values.
Cells with abs(Count) <thresold are skipped, all others will be saved.
Additional to the sparse matrix, a features.tsv (.gz) file is created containing all feature (gene) annotations.
FCS formated listmode data from Cytometry
You may import multiplex cytometry data in FCS 3.0 /3.1 format, e.g. from CyTOF analysis.
"Cells" are imported as conditons (colunms), labels as features (rows).
FCS data contain large number of cells (conditions) which may slow down any analysis options / interactive data viewer.
Therefore, it may be useful to subsample your data.
Instead of loading - and analyzing - all data, use only a fraction of the date.
Upon FCS loding SUMO allows to subsample.
Define the sub-sampling METHOD
- ALL: load evrything, no subsampling.
- Random: Take a random fraction across the whole dataset.
Define the number of features to sample (e.g. 10000) or a fraction of the whole dataset to subsample (eg.e."10%")
To regenerate the same sequence of randomly sub-sampled features, specify a "random seed" e.g. "random,4711"
- First: Sub-sample a certain number - fraction of all - features from the begin of the cell list.
- Last: Sub sample last features from a dataset.
'
- Median: Sub-sample features from the middle of the dataset
- Interlaced: Collect small subset at regular intervals.
Specify e.g. "100,10000" to sub-sample 100 features, skip 1000, sub-sample 100, skip 1000, ...
Define NUMBER/FRACTION of sample to use:
- Number: absolut number of features to subsample.
E.g. for Random "10000" => extract random 10000 featues
- Fraction: relative percentage from whole dataset.
E.g. Interlace "1%,5%" with 100000 features data set.
Will sample 1000 (= 1%), skip 5000 features (=5%)
sample 6000..6999, skip 5000, sample features,
sample 12000..12999, ...