A dialog opens up, asking how to get the reference gene list:
Click the corresponding button.
For option b) and c), COLOM asks to define the column with gene names.
A file previewer shows up:
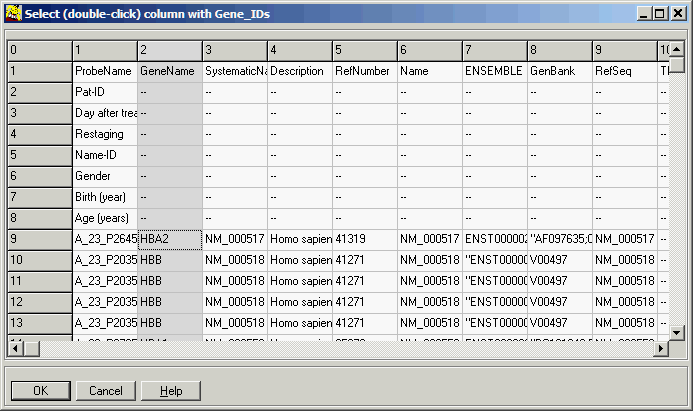
Double-click the column containing gene-names (or single click the column, than
OK-button).
4. Load selection gene list. This is a subset of your expression data resulting from statistical or cluster analysis. COLOM
counts occurrence of selected as well as regulated genes and calculates p-values for all Nodes.
When loading the Selection List, COLOM asks to define a column with gene names and a column with regulation values.
A file previewer shows up:
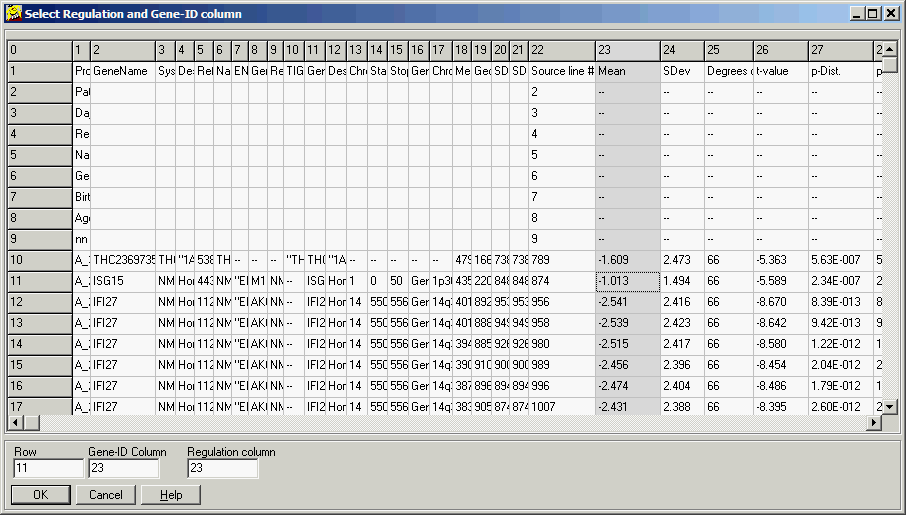
Click into the column containing desired regulation values, than click
Regulation Column edit field.
Now Click into the column containing gene names, than click Gene-ID column
edit field.
Click OK button to continue.
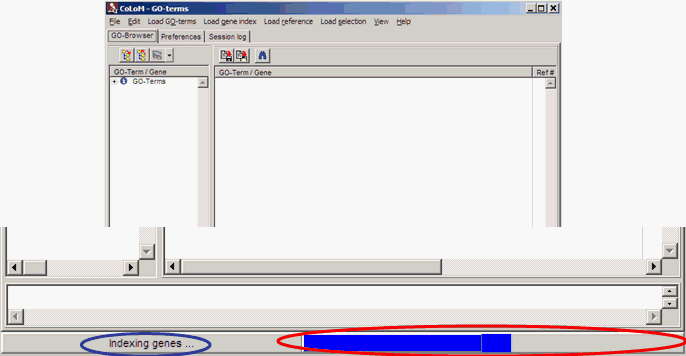
Data loading and processing can require some time.
Therefore, COLOM tells in the status line
what he is doing and indicates the working progress:
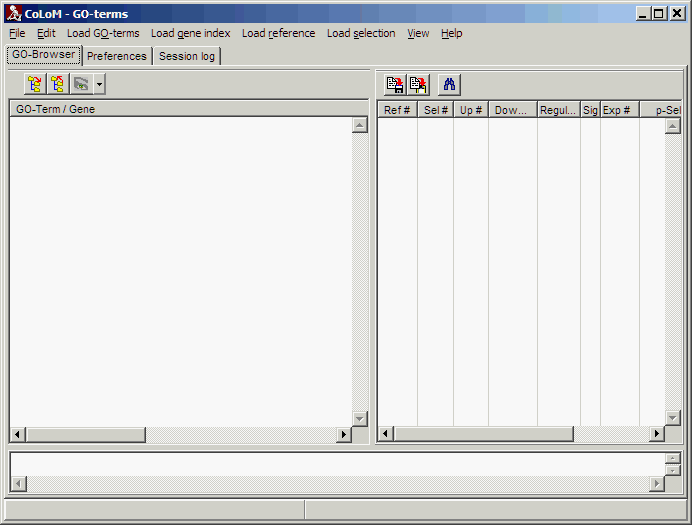
Data View
When all (four) data files were loaded and statistic is calculated you can browse and analyse data.
COLOM now looks like:
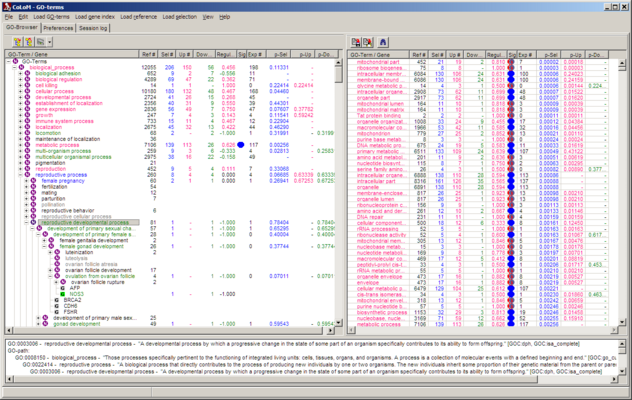
| Left panel |
Brows able hierarchical tree of biological themes |
| Right panel |
Sort able table of populated biological themes |
| Bottom panel |
Info window. Content depends an what was selected in above panels |
Each of the top panels can show the columns:
| Column |
Content |
|
| 1 |
Name of biological role / gene |
Icons indicate:
- N: this is a node=biological theme, Click +/- sign to expand
collapse this node
- G: this is a gene
Text colours indicate (Default colours)
- Gray: no gene in this biological theme or
this gene was not found in reference gene list
- Black: Reference genes for this biological theme found
- Blue: Selection genes found for this node, no nett regulation
- Red: Selection genes found for this node, netto up-regulated
- Green: Selection genes found for this node, netto down regulated
|
| 2 |
Number of genes in the biological theme role in
reference gene list (e.g. ADF file) or
Number of replicates for this gene found in reference list |
|
| 3 |
Number of genes in the biological role found in
selection list or
Number of replicates for this gene found in selection list |
|
| 4 |
Number of up-regulated
genes in the biological role found in selection list or
Number of up-regulated replicates for this gene found in selection list |
|
| 5 |
Number of down-regulated
genes in the biological role found in selection list or
Number of down-regulated replicates for this gene found in selection
list |
|
| 6 |
Net regulation of biological role / gene |
Arithmetic mean from regulation of all genes populating the
respective Biological role / gene |
| 7 |
Significance indicator |
A coloured disk indicates: this biological role is significantly
over/under populated (set critical p-value on preferences tab-sheet).
Colours indicate:
Blue: whole selection
Red: up-regulated
Green: Down-regulated
Yellow: both Up-/Down-regulated |
| 8 |
Number of expected gene for biological role |
|
| 9 |
p-value: significance of populated for the
biological role with all selection
genes |
|
| 10 |
p-value: significance of populated for the
biological role with all up-regulated
genes |
|
| 11 |
p-value: significance of populated for the
biological role with all down-regulated
genes |
|
Size columns or drag columns to change order of columns.
In right panel (table) sort columns by double clicking on column header
(alternatively up-down, down-up).
Customize view by changing fonts/colours columns/names to display on
Preferences tab-sheet.
The info window (bottom panel) shows various information depending what was done:
E.g. single click a node (either in browser or table (left/right panel), herre: aGO-term):
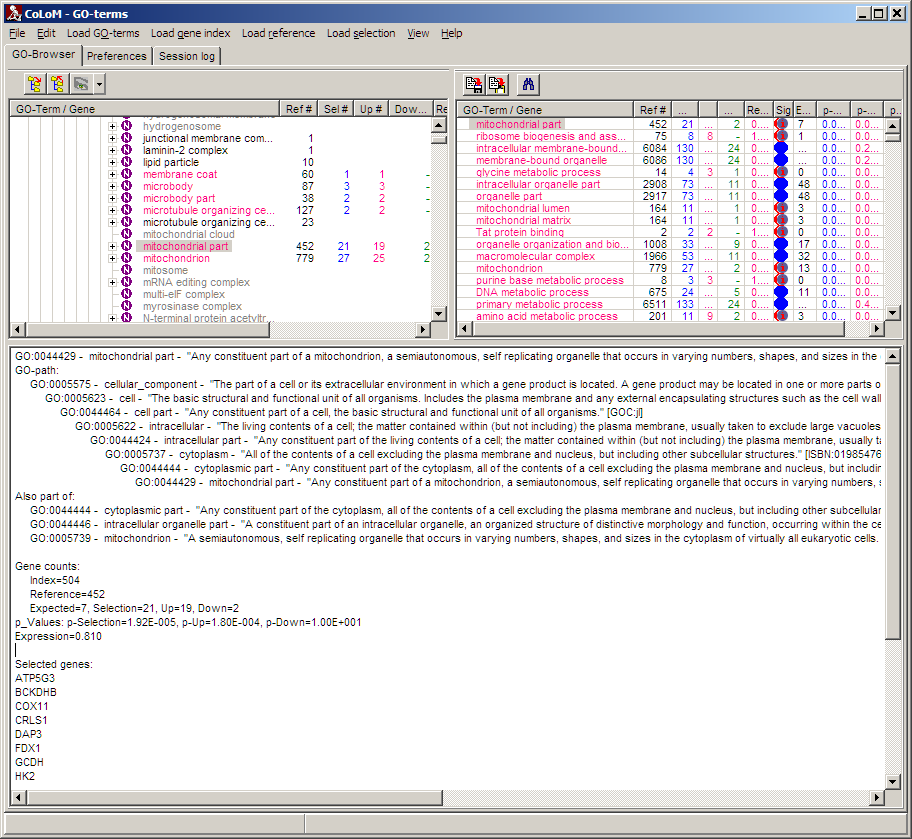
The info window shows:
ID, Name and full description of biological role
Hierarchy path of selected biological role
All other direct parent node where selected biological role is also found
Gene counts (Index, Reference, Expected, Selection, Up-regulated, Down-regulated
P-values (Seletion, Up-regulated, Down-regulated)
List of genes (in Index, Reference, Selection, Up-regulated,Down-regulated, depending on settings
available from context menu in info window (right-mouse click to open)
Double click a Gene node:
A web browser opens up, showing info for the selected gene available from
NCBI'S
Entrez Gene.
Double click a line in table view (right panel):
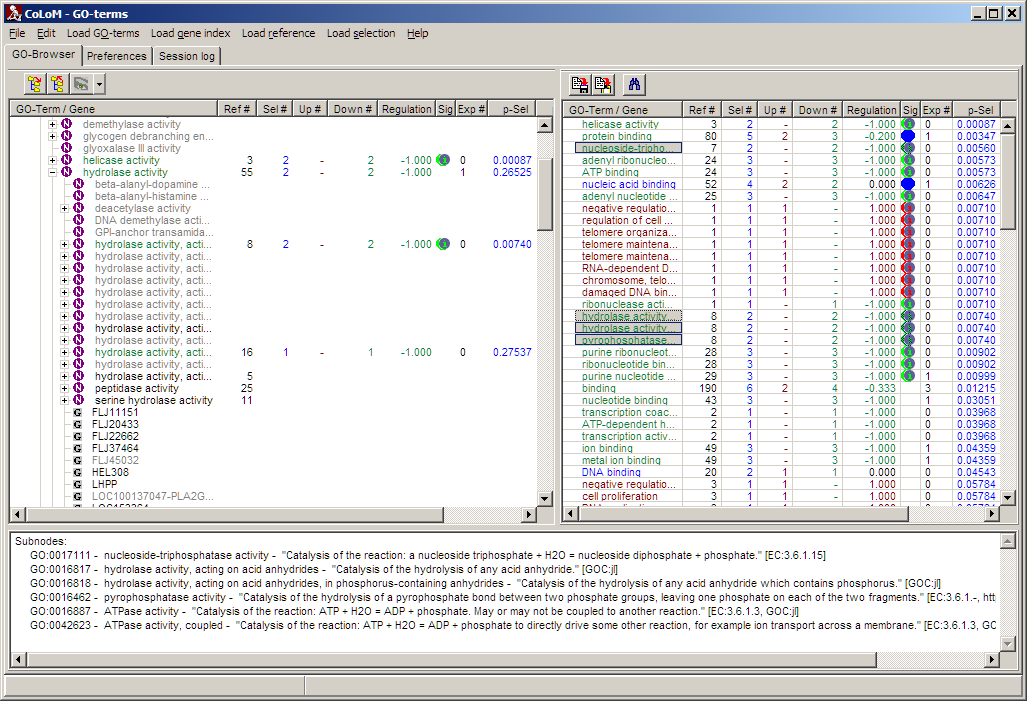
All nodes located in the same sub-tree with the selected node as root get
selected (greyed background) and are listed in the info panel. Thus you can get
an impression whether correlated biological roles are enriched in a certain part
of the sorted table.
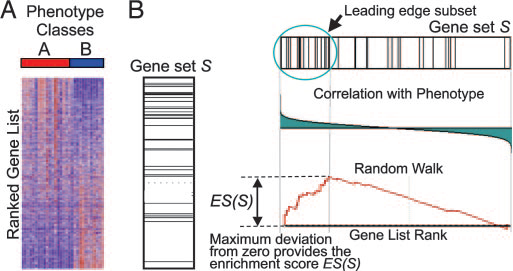
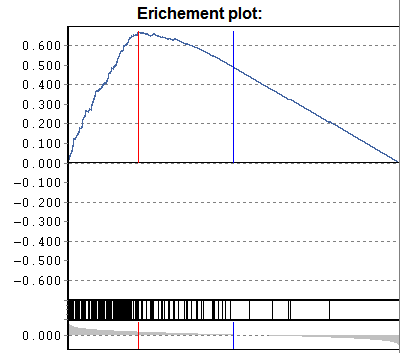
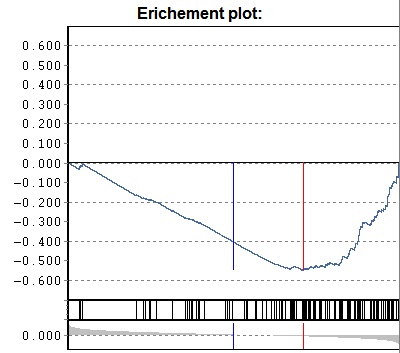
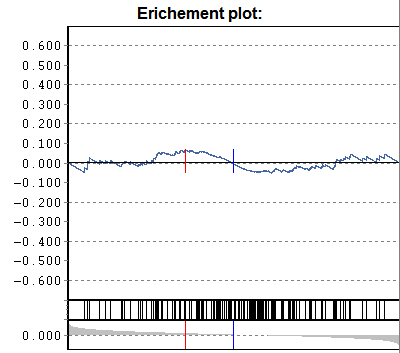
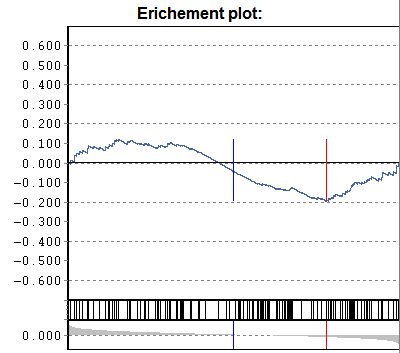
Gene-set enrichment:
Additionally a p-value according to
U-Man-Whitney distribution is calculated, indicating the probability that
selected nodes are enriched as significantly populated nodes.
NB: This computation requires that the data table is
adequately sorted. Eg. sort the data table according to p-Sel (above
example). The computed "enrichment" p-value tells you the probability to
find the selected genes under with lowest-p by chance. If a data are not sorted
accordingly => p-value is meanigless.
Filter
Filter biological role nodes (displayed in tree-view).
Click the filter button:
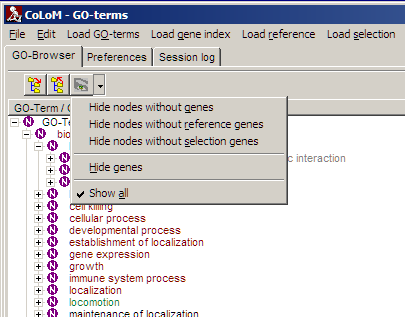
and select the respective filter:
| Hide nodes without genes |
Remove all biological-role nodes where no index genes were found. |
| Hide nodes without reference genes |
Remove all biological-role nodes where no genes from reference list
were found. Also remove all index genes from tree which were not found
in reference-list. |
| Hide nodes without selection genes |
Remove all biological-role nodes where no genes from selection list
were found. Also remove all genes from tree which were not found in
selection-list. |
| Hide Genes |
Remove all genes from tree. Useful when to browse terms only |
| Show all |
Remove all filters => show all nodes. |
Filter table:
Open context menu on column headers and select filter:
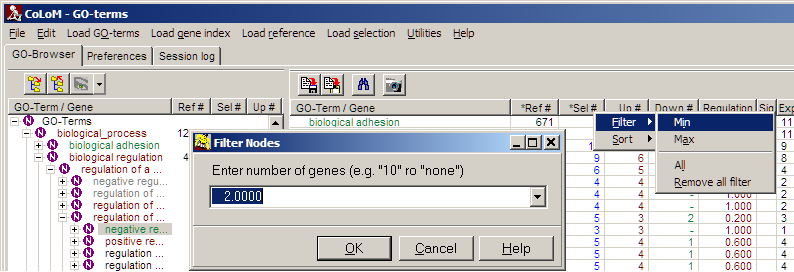
For each data columns Min / Max thresholds can be defined independently. Filters
from multiple columns are combined with logical AND.
a " * " in front of a column name indicates: a filter is set.
| Filter Min |
| Filter Max |
Define maximum value for filtering, i.e. all
items with a value larger Max are removed |
| Filter All |
Disable filtering for this column |
| Remove all filter |
Disable filter for all columns |
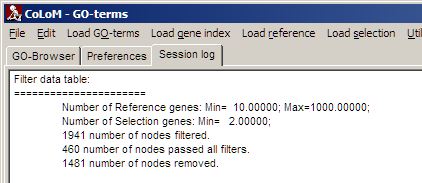
Filter settings can be seen in Session log:
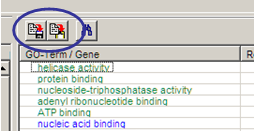
Search
Search in names / descriptions from all loaded genes or biological roles:
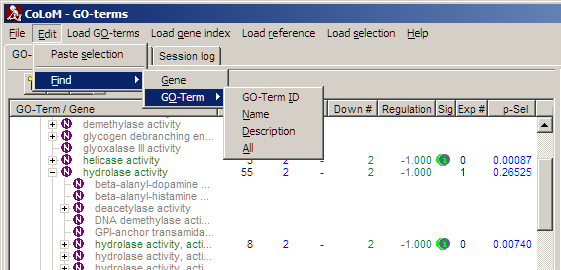
Search result is shown in info-panel.
Search in names / descriptions from
biological roles populated with selection gene. Click the search button
on top of table (right) panel:
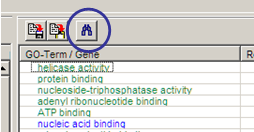
Search result is shown in info-panel.
Copy
Copy statistics table (only selected entries; type Ctrl+A to select all entries.
Click copy buttons on top of data table (right panel):
Left button: Save selection as tab-delimited text file.
Right button: Copy selection as tab delimited text to clipboard (ready to be
pasted into spreadsheet programs.
Paste
Instead of loading Selection gene list from a
text file, you can also copy a list of genes (with additional regulation
information) from any other source and paste it into COLOM.
COLOM expects a list of genes. One gene per line,. Optionally a
numerical regulation value separated by a a TAB.
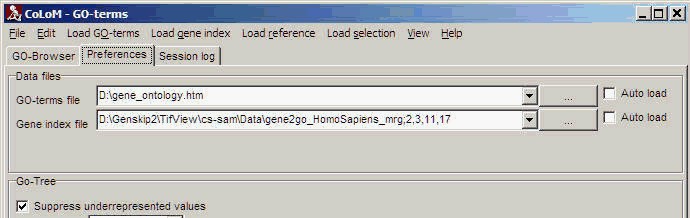
Preferences
Select the Preferences tab-sheet to customize COLOM's default data files and settings:
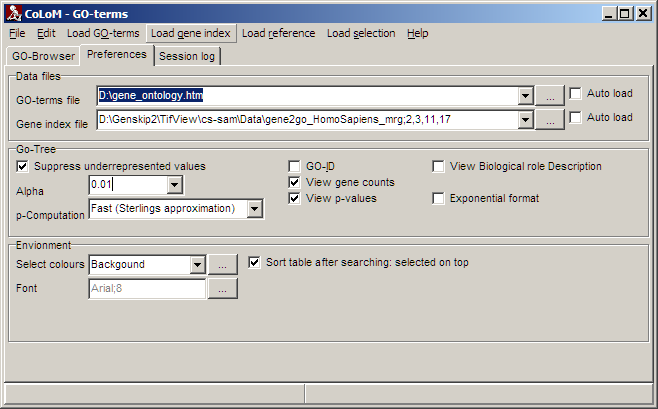
Data files:
Define default files for Biological role tree (here: GO-terms) andGene index.
Click the Auto-load check boxes to automatically load the default files
at start-up of COLOM.
Biological role tree (here: GO-tree)
Define view style of tree and table panel:
| Suppress underrepresented values |
There may be various reasons why too few genes may have passed your
statistical test or clustering.
Therefore you might see too many under-populated nodes. Click this field
to mask underrepresented nodes, i.e. those nodes where number of mapped
genes is lower compared to expected number.
Or more easily: only show over-populated nodes. |
| Alpha |
Critical p-value to mark nodes. Only those nodes with p-values
smaller Alpha are marked with coloured buttons. |
| p-Computation |
|
Biological role ID
(here: GO-ID) |
Display additionally systematic Node ID in tree and table (e.g.
"GO:0044464 - cell part") |
| View biological role description |
Display additionally Node's description in tree and table (e.g.
"cell part - "Any constituent part of a cell, the basic structural and
functional unit of all organisms." [GOC:jl]") |
| View gene counts |
Display columns containing gene counts in tree and table panel |
| View p-values |
Display columns containing p-values in tree and table panel |
| Exponential format |
View p-values in exponential format: Instead of 0.00341 =>
3.41E-003.
Most interesting for p-values is the order of magnitude (E-003).
Everything below E-002 is interesting. As smaller as better
(E-006,E-007,...) |
| |
|
Data files and file formats
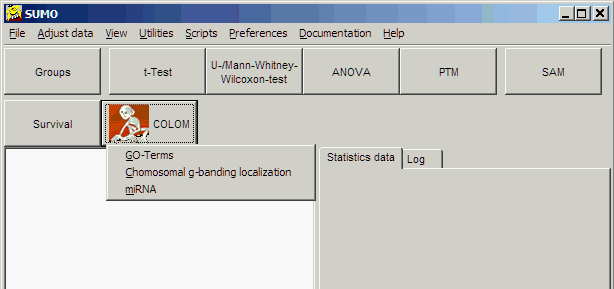
As mentioned above COLOM requires 4 data sets to evaluate co-localisation information:
- Biological role (e.g. GO-terms, Chromosomal bands, pathways, ...)
- Gene index (associates genes to biological roles, e.g. ALB => GO:0019836 hemolysis of symbiont ...
- Reference gene list (all genes on e.g. a micro-array)
- Selection list (filtered genes, e.g. significant gene from a t-test)
Two of them (Biological role and Gene Index)
are normally derived from common available resources. Below a description of
data file formats COLOM expects for the different kind of analysis.
Reference and Selection
gene lists are simple tab delimited text files.
Download respective Biological role and corresponding Gene index files and "install" them with COLOM:
Got to preferences page and select just downloaded role/gene index files in the respective fields.
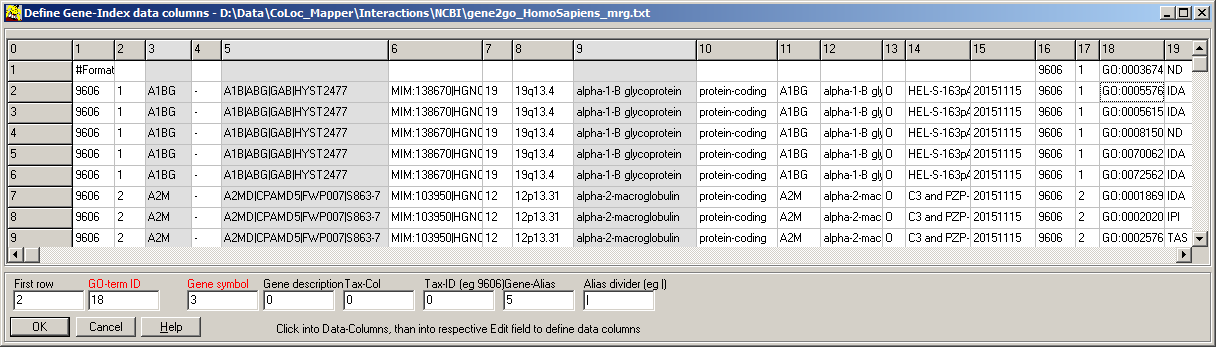
For the gene index, you have to define the respective columns:
- A file dialog opens-up, shwowing the first few lines from the selected gene index file.
- Identify required data columns
- set the column IDs in the respective edit fields
 Check both auto load fields.
Close and restart COLOM
GO-Terms
Biological Role:
GO-tree |
Names, description and relationship of GO-terms (i.e.
which GO-term is part of another).
SUMO expects GO-tree data in
OBO v1.2 data format.
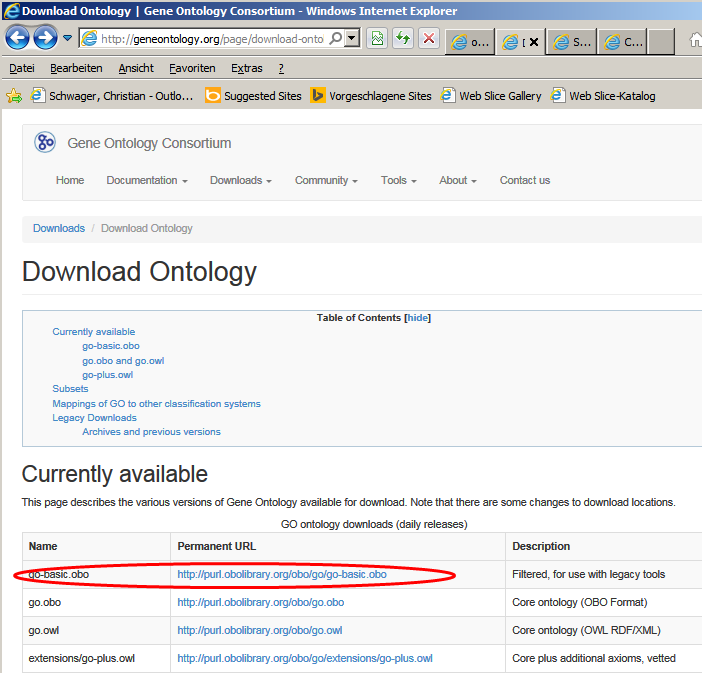
A good source for an up-to-data GO download is the
Gene ontologies
download page.
Download GO-ontology files in OBOv1.2 format:
|
| Gene-Index: |
Association: which gene is associated => to a certain GO-term.
SUMO expects a tab delimited data file containing columns with
| GO-ID |
GO:0040007 |
| Gene |
BMP10 |
| Description |
Bone morphogenetic protein 10 precursor (BMP-10).[Source:Uniprot/SWISSPROT;Acc:O95393] |
You can generate such files e.g. with
ENSEMBLE
Biomart.
One example of a recent (from 11.01.2008) version of
such a file may be downloaded from
here.
(Right mouse click | Save as)
Another source may be
NCBI. From their
FTP-site, navigate to
Gene-Data folder.
The gene2go.gz file links Gene-IDs to GO-terms. The gene2go files contains
several hundred thousands of lines for all organisms Thus, it may be helpful to
filter only those lines containing info for the organism of interest (by
Taxonomy-ID, e.g. 9606=homo sapiens, 10090=mus musculus, 10116=rattus norwegicus,
...)
The gene_info.gz file contains detailed annotations for Gene-IDs (e.g.
description, chromosomal localization, gene symbol...). The gene_info file
contains a few million lines for all organisms. Again, it may be helpful to
filter only those lines for the organisms of interest by Taxonomy_ID (as above).
Alternatively, browse to the
GENE_INFO folder and
download the gene-info for the organism of interest (e.g. human: go to subfolder
Mammalia and
download
Homo_sapiens.gene_info.gz)
Uncompress the files (most Zip-compressors e.g.
Winzip can handle ".gz" files) and merge the data files by the Gene_ID (e.g.
with TableButler). |
Recent files (up-dated every few weeks, last updated at)
can be downloaded from SUMO site. Better visit above
mentioned sites (or other), download and pre-process data to generate optimised
data files for use with COLOM.
Chromosomal bands
"
G-banding is technique used in
cytogenetics to produce differently stained regions on condensed
chromosomes. The metaphase chromosomes are treated with trypsin
(to partially digest the protein) and stained with Giemsa. Dark
bands that take up the stain are strongly A,T rich (gene poor).
(...) Banding can be used to identity chromosomal abnormalies,
such as translocations, because there is a unique pattern of
light and dark bands for each chromosome."
(from
Wikipedia)
Biological role:
Ideogram |
List of Chromosomal bands.
COLOM expects a tab-delimited ideogram
data file containing:
- one chromosomal band per line
- 1. column: Chromosome number (e.g. 1..22,x,y)
- 2. column: arm (e.g. p,q)
- 3. column: band (ter,cen,1,11,11.1,11.1a, ...)
Such a file may be downloaded from
NCBI's FTP site:
e.g.
ideogram.gz (right mouse-click, Save as):
|
#chromosome |
arm |
band |
iscn_start |
iscn_stop |
bp_start |
bp_stop |
stain |
density |
bases |
|
1 |
p |
ter |
0 |
1 |
0 |
0 |
|
|
1 |
|
1 |
p |
|
0 |
7335 |
1 |
124300000 |
|
|
124300000 |
|
1 |
p |
3 |
0 |
4852 |
1 |
84700000 |
|
|
84700000 |
|
1 |
p |
36 |
0 |
1521 |
1 |
27800000 |
|
|
27800000 |
|
Gene index:
Genes-to-ideogram |
Association: which gene is located on a certain chromosomal band.
COLOM expects a tab delimited data file containing
- one gene per line
- one column containing chromosomal band
where gene is located
- one column containing gene name
- one column containing gene description
Such a file may be downloaded from
NCBI's FTP site E.g.
cyto_gene.md.gz for homo sapiens. Data files from other organisms may be downloaded from respective
directories.
|
#tax_id |
chromosome |
iscn_start |
iscn_end |
orientation |
featureName |
featureId |
featureType |
printLocation |
units |
|
9606 |
1 |
1839 |
1895 |
na |
A3GALT2 |
GeneID:127550 |
GENE |
1p35.1a |
BandsAsInt |
|
9606 |
1 |
660 |
710 |
na |
AADACL3 |
GeneID:126767 |
GENE |
1p36.21d |
BandsAsInt |
|
9606 |
1 |
660 |
710 |
na |
AADACL4 |
GeneID:343066 |
GENE |
1p36.21d |
BandsAsInt |
|
9606 |
1 |
5682 |
5741 |
na |
ABCA4 |
GeneID:24 |
GENE |
1p22.1a |
BandsAsInt |
|
9606 |
1 |
13847 |
13906 |
na |
ABCB10 |
GeneID:23456 |
GENE |
1q42.13e |
BandsAsInt |
|
9606 |
1 |
5741 |
5795 |
na |
ABCD3 |
GeneID:5825 |
GENE |
1p21.3d |
BandsAsInt |
|
Here a few ready to use recent (up-dated every few weeks) date files:
NCBI data files are g-zipped. Standard MS-Windows utilities (e.g. freeware 7-zip, commercial
Winzip, WinRar) can unpack such archives.
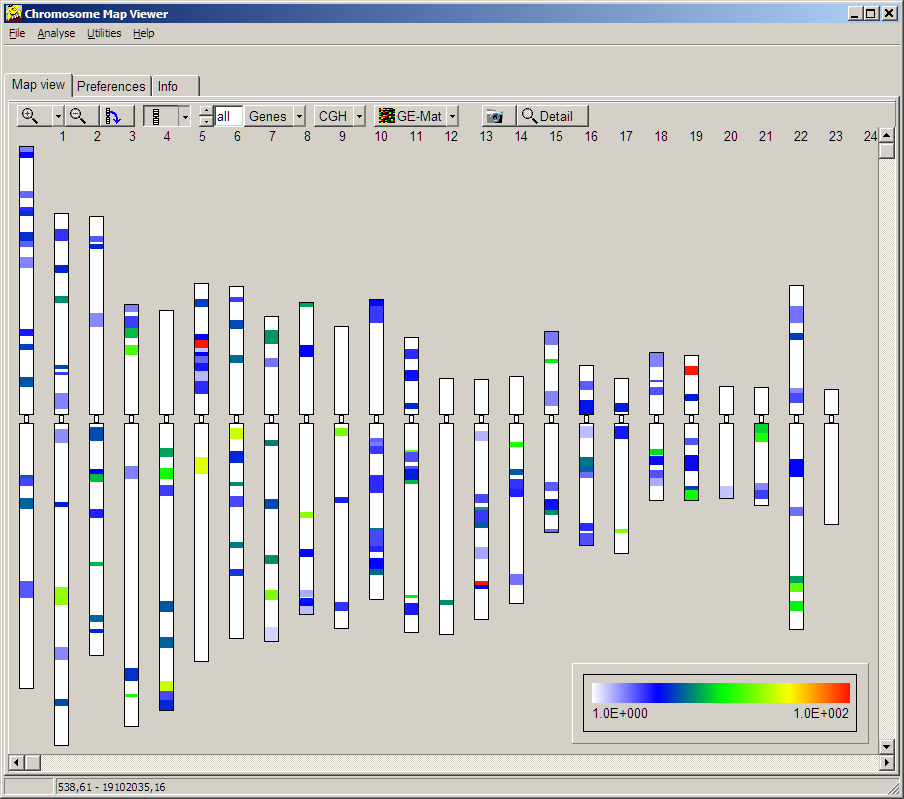
When performing COLOM with chromosomal bands you get a new tool-button:
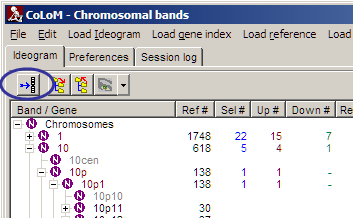
Click the button to visualise the statistics as "Coloured Chromosomes":
At first use of "Coloured Chromosomes", goto Preferences tabsheet and define Ideogram and gene index files similiarly to the method in COLOM.
KEGG metabolic pathways
"KEGG PATHWAY is a collection of manually
drawn pathway maps representing our knowledge on the molecular interaction and
reaction networks for:
-
Metabolism
Carbohydrate Energy Lipid Nucleotide Amino acid Other amino acid
Glycan PK/NRP Cofactor/vitamin Secondary metabolite Xenobiotics
-
Genetic Information Processing
-
Environmental Information Processing
-
Cellular Processes
-
Human Diseases
and also on the structure relationships (KEGG drug structure maps) in:
-
Drug Development"
For more details about KEGG visit their
web-site.
Sine 2011, KEGG pathway database is no longer freely available from KEGG-ftp-site via anonyous download.
Instead, you may subscribe to their ftp-site, and donwload KEGG data for personal or institutional use.
If you have access to the KEGG database, extract the information to a folder on your local computer:
- save "kegg/pahtway/pathway.list" to a local file.
This file is required to map Pathway IDs to pathway Names (e.g. "02010 ABC transporters")
- unpack all files from any of the organism specific archives (e.g. "/kegg/pathway/organisms/hsa.tar.gz"
for all homo sapines pathways) into the same folder.
COLOM uses the *.conf files for mapping genes to pathways and the *.png files for display.
In COLOM, goto preferences page.
As "KEGG file", select any of the previously unpacked "*.conf" files.
An outdated set of KEGG pathway files (donwloaded in 2011 via anonymous ftp from KEGG ftp site) may be downoaded
from SUMO site for exploring the functionality of COLOM
All data are packed in a selfextracting archive.
For serious work, better subsribe to KEGG and use updated data.
Members from DKFZ may use the up-to-data KEGG pathway database which is availabel via HUSAR (DKFZ wide subscription to KEGG).
miRNA
Wikipedia:
A microRNA (abbreviated miRNA) is a short ribonucleic acid (RNA) molecule found in eukaryotic cells.
A microRNA molecule has very few nucleotides (an average of 22) compared with other RNAs.
miRNAs are post-transcriptional regulators that bind to complementary sequences on target messenger RNA
transcripts (mRNAs), usually resulting in translational repression or target degradation and gene silencing.
The human genome may encode over 1000 miRNAs, which may target about 60% of mammalian genes and
are abundant in many human cell types.
Biological Role: a list of miRNAs
COLOM expects a tab delimited text file containing a colomn with miRNA names:
| | MicroRNA | miR | GeneID | Gene |
|---|
| MI0000266 | hsa-miR-10a | 23054 | NCOA6 |
| MI0000102 | hsa-miR-100 | 2475 | FRAP1 |
| MI0000109 | hsa-miR-103 | 2746 | GLUD1 |
| MI0000109 | hsa-miR-103 | 9493 | KIF23 |
| .... |
Gene index: a list of associations miRNA => Gene
| | MicroRNA | miR | GeneID | Gene |
|---|
| MI0000266 | hsa-miR-10a | 23054 | NCOA6 |
| MI0000102 | hsa-miR-100 | 2475 | FRAP1 |
| MI0000109 | hsa-miR-103 | 2746 | GLUD1 |
| MI0000109 | hsa-miR-103 | 9493 | KIF23 |
| .... |
One source for miRNA <=> Gene interactions might be miRWalk database.
For details how data were generated see:
Dweep, H., Sticht, C., Pandey, P., Gretz, N.,
miRWalk - database: prediction of possible miRNA binding sites by "walking" the genes of 3 genomes,
Journal of Biomedical Informatics (2011), doi: 10.1016/ j.jbi.2011.05.002 (JBI PMID:21605702)
They supply:
- Validated targets: associations are derived from literature.
- Predicted targets: associations are derived from sequence homolgy between miRNA and gene sequence.
Here a few association lists extracted from miRWalk database (built 09-2012, not updated).
Predicted: different lists, with assocications detected with 1 up to all 10 algorithms supported by miRWAlk:
The names stands for e.g. MirToGene_813k_650miR_15294.txt
- 813000 association miRNA <=> gene
- 650 miRNA
- 15294 genes
A list MirToGene_813k_650miR_15294.txtcompiled of
- all miRNAs hit by at least 5 algorithms
- new miRNAs hit by at least 4 algorithms
- new miRNAs hit by at least 3 algorithms
- new miRNAs hit by at least 2 algorithms
- new miRNAs hit by at least 1 algorithms
Validated: hsa_mirwalk_validated.txt
TransFac
MSig-DB
The Molecular Signatures Database (MSigDB) is a collection of annotated gene sets for use with GSEA software.
The MSigDB is maintained by the GSEA team with the support of our MSigDB Scientific Advisory Board.
For more information of MSigDB visit GSEA
website at Broad institute.
Or read their publication or
complementary.
The GSEA software and source code and the Molecular Signatures Database (MSigDB) are freely
available to individuals in both academia and industry for internal research purposes. Please
see the GSEA/MSigDB license for more details.
Register at GSEA site, go to download page and get the respective database for your reseach.
Select the databases using GENE SYMBOLS
CoLoM expects
- ASCII text files
- One Signature/Pathway per line
- Tab delimited in each line:
- signature name
- Url to a website with additional information for the signature (may be dummy)
- list of gene symbols mapped to the signature (divided by tabs (#9)
E.g.
| TRANSITION_METAL_ION_TRANSMEMBRANE_TRANSPORTER_ACTIVITY | http://www.broadinstitute.org/gsea/msigdb/cards/TRANSITION_METAL_ION_TRANSMEMBRANE_TRANSPORTER_ACTIVITY | SLC11A2 | FXN | SLC30A4 | SLC30A5 | CCS | SLC30A3 | SLC31A2 | SLC31A1 | ... |
| CYCLASE_ACTIVITY | http://www.broadinstitute.org/gsea/msigdb/cards/CYCLASE_ACTIVITY | GUCY2F | ADCY9 | ADCY7 | ADCY8 | RTCD1 | GUCY1A2 | GUCY1A3 | GUCY1B3 | ... |
| LOW_DENSITY_LIPOPROTEIN_BINDING | http://www.broadinstitute.org/gsea/msigdb/cards/LOW_DENSITY_LIPOPROTEIN_BINDING | APOA4 | CDH13 | LDLR | ANKRA2 | STAB1 | CXCL16 | SORL1 | LRP6 | ... |
| MAP_KINASE_KINASE_KINASE_ACTIVITY | http://www.broadinstitute.org/gsea/msigdb/cards/MAP_KINASE_KINASE_KINASE_ACTIVITY | MAP3K7 | MAP3K6 | MAP3K5 | MAP3K4 | ZAK | MAP3K3 | MAP3K9 | MAP3K10 | ... |
| ... |
Due to the straight structure, it might be comfortable to generate your own
signature / theme database in MSig-DB format and use it with CoLoM.
Wiki pathways
Another source for publicly available and publicly curated pahways might be the Wiki Pathways project:
"WikiPathways is an open, public platform dedicated to the curation of biological pathways by and for the scientific community.
WikiPathways was established to facilitate the contribution and maintenance of pathway information by the biology community.
WikiPathways is an open, collaborative platform dedicated to the curation of biological pathways. (...)
More importantly, the open, public approach of WikiPathways allows for broader participation by the entire community,
ranging from students to senior experts in each field. This approach also shifts the bulk of peer review, editorial curation,
and maintenance to the community."
For more detail visit the Wiki Pathways web page.
To work with Wiki pathways within CoLOM download the patways from their download area.
Pathways for various organisms are availabe.
Download:
Unpack both Zip-archives into any filder.
On CoLOM's Preferences page, click the "..." and navigate to the folder where you just extracted the data.
Select any of the *.gpml files.
Check Autoload.
Close and restart CoLoM.
Reactome
On Reactome Website we can learn:
"Reactome is a free, open-source, curated and peer-reviewed pathway database.
Our goal is to provide intuitive bioinformatics tools for the visualization, interpretation
and analysis of pathway knowledge to support basic research, genome analysis, modeling,
systems biology and education."
from https://reactome.org/
Reactome data can be downloaded from Reactome Donwload web page,
CoLoM uses:
- The complete list of pathways
This list contains all Reactome pahtways for all species (~21000 pathways, 08-2021).
You may filter the list for your specie of interest, e.g.
- "homo sapiens" (~2500 pathways. 08-2021)
- "mus musculus" (~1700 pathways, 08-2021),
....
- NCBI to All pathways
A list of associations: NCBI gene-IDs to Reactome pathways (~1118000 assignments, 08-2021).
You may filter the list for your specie of interest, e.g.
- "homo sapiens" (~215000 assignments, 08-2021)
To translate Gene-IDs into Gene Names / Sybmols (e.g. 3251 => HPRT1) CoLoM uses NCBI's Gene-Info data, downloadable from NCBI' ftp site.
Use specie specific (e.g.../Mammalia/Homo_Sapiens.gene_info.gz) files or a general info file (e.g.../Mammalia/All_Mammalia.gene_info.gz), and filter for a relevant specie (e.g. Homo sapiens => Tax-ID 9606).
.
Furthermore, CoLoM extracts alias gene names to resolve alternate namings.
All data should be combined into a Reactome Database to be used with COLOM.
This data base is adopted from Broads's MSig-DB signature file format (*.GMT):
First part contains TAB-separated pathway information:
R-HSA-350054:Notch-HLH transcription pathway  --  HDAC6	HDAC5	MAMLD1	CREBBP	SNW1	KAT2A	HDAC1	HDAC2	RBPJ	NOTCH1	NOTCH2	NOTCH3	...
R-HSA-350562:Regulation of ornithine decarboxylase (ODC)	--	PSME3	PSMD14	PSMB11	PSMA8	NQO1	PSME4	OAZ1	OAZ2	ODC1	AZIN1	OAZ3	PSMA1	PSMA2	...
R-HSA-349425:Autodegradation of the E3 ubiquitin ligase COP1	--	PSME3	PSMD14	PSMB11	PSMA8	PSME4	ATM	PSMA1	PSMA2	PSMA3	PSMA4	PSMA5	PSMA6	PSMA7	PSMB1	...
Followed by the Alternate name section:
[Gene-Alias-List]
A1BG	A1B|ABG|GAB|HYST2477
A1CF	ACF|ACF64|ACF65|APOBEC1CF|ASP
A2M	A2MD|CPAMD5|FWP007|S863-7
...
//[Gene-Alias-List]
A prebuild (from 08-2021) - but not regularly updated - data base may be downloaded for test cases from SUMO site:
Reactome-homo_sapiens.gmt
But it would be preferable to generate the database from original freshly downloaded data files.
COLOM provides a tool to download data and create specie specific databases for use with CoLoM.
In CoLoM popup menu select Build databases | Reactome:
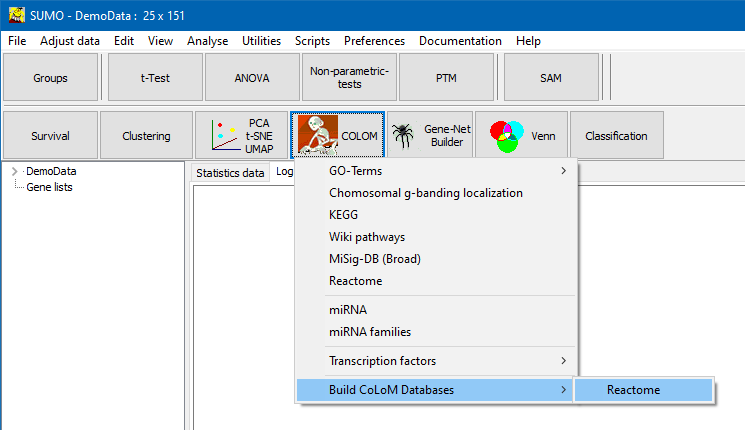
A parameter Dialog opens up:
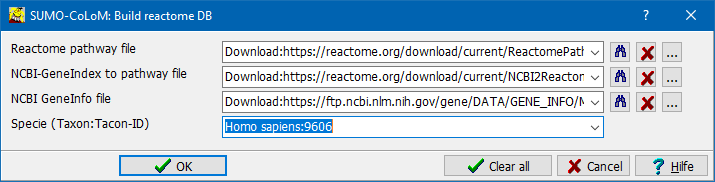
Specify the three source data files (see above):
- Download locations from Reactome/NCBI and save them with default names in "SUMO-folder\data\colom\reactome"
In the selection fields specify "download:URL".
From the selection's drop-down you can select the download link to the respective data files as valid in 08-2021.
Downloaded files are saved in "SUMO-folder\data\colom\reactome",
using:
- ReactomePathways.txt
- NCBI2Reactome.txt
- Gene_info.gz
for the three files.
- Use previously downloaded default files (see above>
Just empty all selection fields.
CoLoM searches the files in the "SUMO-folder\data\colom\reactome" folder,
using the above default mentioned filenames.
- Specify custom names/location for the respective files
Take care, that selected files have requested content and data format.
!! Wrong files/formats will result in empty, incomplete or non-functional data bases !!
Specfiy the specie (taxon) to filter for.
Specify "taxon-name:Taxon-ID" (e.g. "homo sapines:9606".
CoLoM tries to download / open the files and build the specie specific CoLoM-database.
The resulting CoLoM-database is stored as "SUMO-folder\data\colom\reactome\Reactome-SPECIE.gmt".
Now you may select the newly generated database on CoLoM's preferences tab-sheet.
Depending on internet conection and server loads downloading of data files may take some while. Thus be patient.
Work progress and results are shown in CoLoM's Session-Log tab-sheet / status bar.
Reference gene lists
Selection gene lists