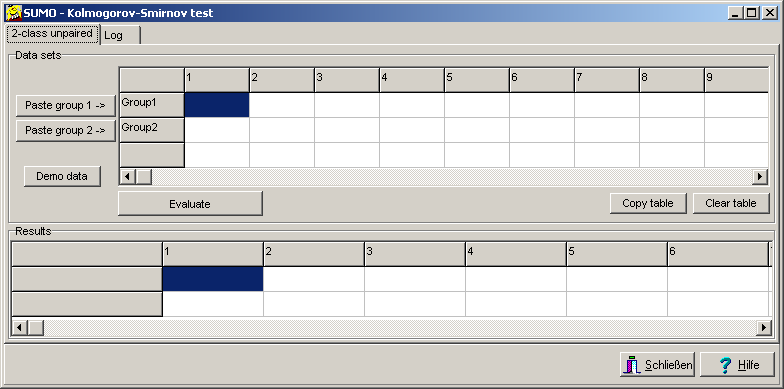
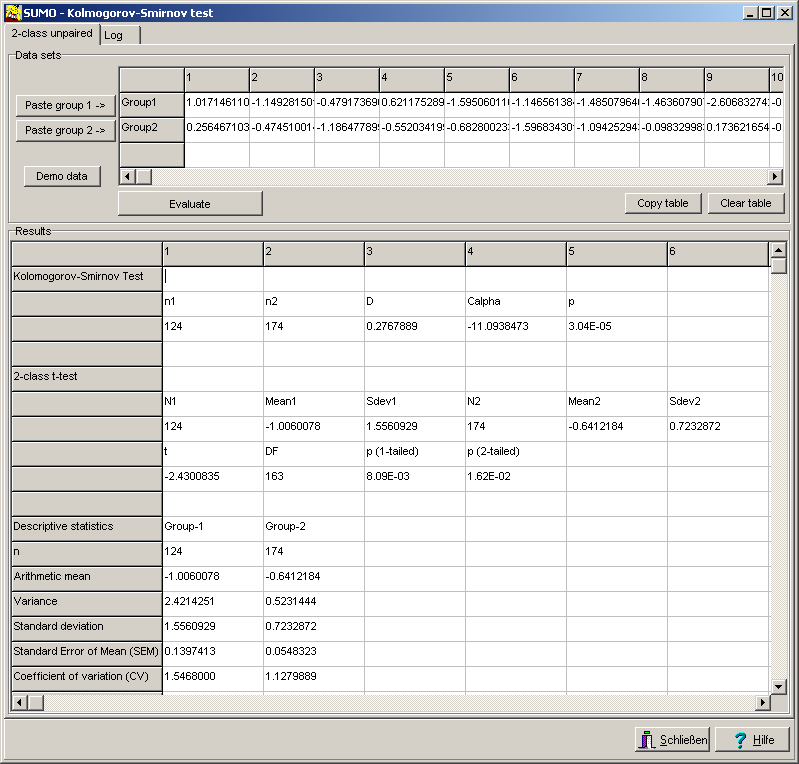
MAin menu | Utilities | Statistic tests | 2x2 cross table
A new Winwow opens up:
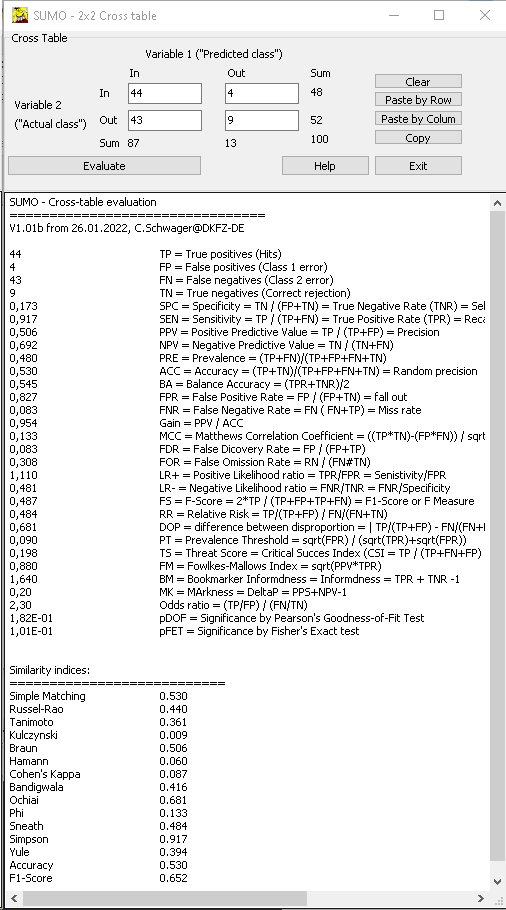
Fill in the values und press Evaluate button to compute the association values.
Neumann trend test
Correlation coefficient r => p-value
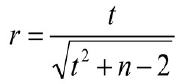
What is the probability that a given correlaton value (r) measured with a given number of samples (n) is just random (p~1) or very unexpected (p<<0) ?In a first step we can compute a t-value:
 r should be in the range: -1 < r < 1, n > 2
(adopted from: Miles and Banyard's (2007), Understanding and Using Statistics in Psychology --- A Practical Introduction)
From t-distribution we can find the corresponding p-value.
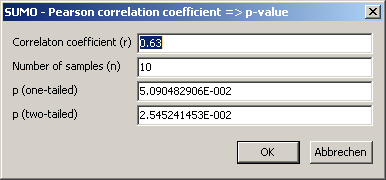
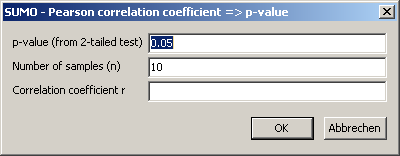
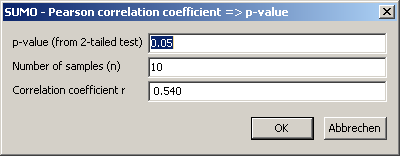
In SUMO select Main menu | Utilities | Statistic tests | Correlation coefficient => p-value
Enter your data (r and n).
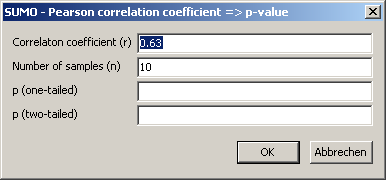
Click OK-button to compute p:
Edit r / n and recompute p, or Cancel this utility.
Probability => Correlation coefficient r
What correlation coefficent r do I need to yield a certain probability value p ?In a first step, we can get the t-value from an inverse t-distrubtion for the desired p-value.
Applying and converting the above formula we can compute r:
In SUMO select Main menu | Utilities | Statistic tests | p-value => Correlation coefficient
Enter your data(p and n).
Click OK-button to compute p:
Edit p / n and recompute r, or Cancel this utility.
Mantel test - Test for similarity of two matrices
Wikipedia explains:The Mantel test, named after Nathan Mantel, is a statistical test of the correlation between two matrices. The matrices must be of the same dimension; in most applications, they are matrices of interrelations between the same vectors of objects.
Originally the Mantel test was introduced to compare distance matrices: square matrices with identical dimensions and positive data values.
But the tst may be also performed with not squared matrices.
The two matrices must have:
- Same dimensions (i.e. same number of rows/columns).
In case the two matrices have different dimensions, SUMO truncates the larger one to the dimension of the smaller one. - Positive data values
negative data values are processed too, but the test result may be meaningless - All data cells should contain numbers.
SUMO converts non numeric data or empty data cells to ZERO - Numbers hould be supplied in international format (decimal-point as divider)
SUMO tries to convert german format (decimal-comma)
Mantel's test statistic is comupted with a basic cross product formula:
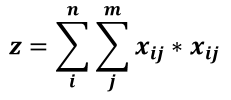
With x,y two (square) non-negative matrices with n, m number of rows/columns.
A normalized correlation value is computed:
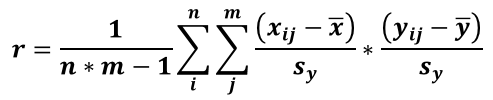
with ‾x, ‾y = average from matrix x and y respectively.
sx, sy, = standard deviation from matrix x and y respectively
r ranges from -1 ... 1-
- r=1 : highest similarity, matrices are identical
- r~0 : just random values, no similarity
- r=-1 : matrices are contradictory
A significance value for similarity is computed based on a permutation scheme wher rows and columns of (one) matrix are radomly shuffeld.
For each of the np permutation an r' is computed
The number m of permutations where r' < r is counted and onverted into a p-value:
p = (m+1) / np
To extract a trustful p-value, the number of permutations should be adopted to the critical p-value:
| p | np |
|---|---|
| 0.05 | 1000 |
| 0.01 | 5000 |
| 0.001 | 50000 |
| ... | ... |
With SUMO select:
Main menu | Utilities | Statistics | Mantel test
In the parameter dialog select/specify:
- Data matrix files: either type the names, separated by semicolon
click the ... button to open a file selection box
drag files from file explorer into the data-matrix field - Header rows/columns: define number of such rows/coloms, containing description/annotions not useful for computation
Header rows/colums MUST be identical in the matrices - Number of permutation cycle for computation of p-value